Onix Solar

  • Market Cap: Micro Cap
  • Industry: Non - Ferrous Metals
  • ISIN: INE173M01012
  • NSEID: ONIXSOLAR
  • BSEID: 513119
INR
348.35
16.55 (4.99%)
BSENSE

Sep 01, 03:30 PM

BSE+NSE Vol: 1.58 lacs

  • Price Points
  • Score
  • Mojo Parameters
  • Total Return
  • News and Corporate Actions
  • Key factors
  • Shareholding
  • Financials
  • CompanyCV
stock-summaryPrice Point
High/Low

1Day

52 Week

Valuation
Technical
Day's Volume

CASH

1.58 lacs (-43.81%) Volume

Shareholding (Mar 2026)

FII

0.00%

Held by 0 FIIs

DII

0.77%

Held by 0 DIIs

Promoter

74.98%

Why is Onix Solar Energy Ltd falling/rising?

02-Sep-2026

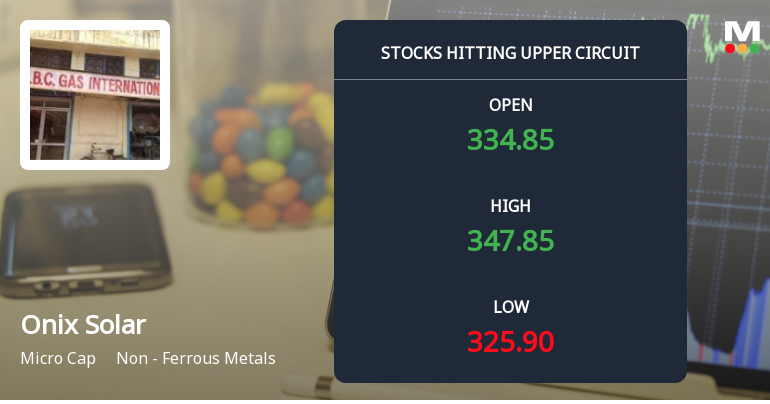
As of 01-Sep, Onix Solar Energy Ltd's stock price is rising to Rs 347.85, up 5.0%, driven by strong recent performance, increased investor interest, and solid financial fundamentals. The stock has gained 25.19% over the past week, significantly outperforming the benchmark Sensex.

As of 01-Sep, Onix Solar Energy Ltd's stock price is rising, currently at Rs 347.85, reflecting an increase of Rs 16.55 or 5.0%. This upward movement can be attributed to several factors. Firstly, the stock has shown a remarkable performance over the past week, gaining 25.19%, significantly outperforming the benchmark Sensex, which declined by 0.92% during the same period. Additionally, the stock has been on a consecutive gain streak for the last five days, indicating strong positive momentum.<BR><BR>Investor participation has also increased, with a delivery volume of 6.59 lacs on August 31, which is up by 16.15% compared to the five-day average. This suggests growing interest and confidence among investors. Furthermore, the stock's performance today has outperformed its sector by 5.08%, reinforcing its strong market position.<BR><BR>The company's financial health supports this rise, with a low Debt to EBITDA ratio of -0.89 times, indicating a strong ability to service debt. The company has demonstrated healthy long-term growth, with net sales increasing at an annual rate of 90.90%. Notably, the company reported very positive results in March, with net sales reaching their highest at Rs 70.30 crore and a significant growth in profit after tax.<BR><BR>Overall, the combination of strong recent performance, increased investor participation, and solid financial fundamentals contributes to the rising stock price of Onix Solar Energy Ltd.

View full answer

Who are in the management team of Onix Solar?

01-Sep-2026

The management team of Onix Solar includes S P Shorewala (Chairman & Director), Rohith Shorewala (Whole-time Director), Neelam Shorewala (Non-Executive & Non-Independent Director), Yash Ratanlal Mardia and Akhilesh Ashwini Singhal (Non-Executive & Independent Directors), and Padma Tapariya (Company Secretary & Compliance Officer). They oversee the company's operations and strategic direction.

The management team of Onix Solar includes the following individuals:<BR><BR>1. **S P Shorewala** - Chairman & Director<BR>2. **Rohith Shorewala** - Whole-time Director<BR>3. **Neelam Shorewala** - Non-Executive & Non-Independent Director<BR>4. **Yash Ratanlal Mardia** - Non-Executive & Independent Director<BR>5. **Akhilesh Ashwini Singhal** - Non-Executive & Independent Director<BR>6. **Padma Tapariya** - Company Secretary & Compliance Officer<BR><BR>This team is responsible for overseeing the company's operations and strategic direction.

View full answer

What does Onix Solar do?

01-Sep-2026

No Company Information Available

Who are the peers of the Onix Solar?

01-Sep-2026

Onix Solar's peers include Pondy Oxides, Arfin India, Bhagyanagar Ind, Maan Aluminium, MMP Industries, Divine Power, Baheti Recycling, Nupur Recyclers, and Sunlite Recycli. Bhagyanagar Ind leads in 1-year returns at 337.26%, while Onix Solar has a 1-year return of 38.04% and an excellent capital structure.

Peers: The peers of Onix Solar are Pondy Oxides, Arfin India, Bhagyanagar Ind, Maan Aluminium, MMP Industries, Divine Power, Baheti Recycling, Nupur Recyclers, and Sunlite Recycli.<BR><BR>Quality Snapshot: Excellent management risk is observed at Pondy Oxides, while Average management risk is found at Arfin India, Maan Aluminium, MMP Industries, Divine Power, Baheti Recycling, Sunlite Recycli, and Onix Solar. Below Average management risk is noted for Bhagyanagar Ind and Nupur Recyclers. Excellent growth is seen at Bhagyanagar Ind, Divine Power, Baheti Recycling, and Sunlite Recycli, while Good growth is attributed to Onix Solar and Average growth is found at Arfin India, Maan Aluminium, and MMP Industries. Below Average growth is observed at Nupur Recyclers. Excellent capital structure is noted for Onix Solar, while Good capital structure is seen at Pondy Oxides, Maan Aluminium, and MMP Industries. Below Average capital structure is found at Arfin India, Bhagyanagar Ind, Divine Power, Baheti Recycling, and Nupur Recyclers.<BR><BR>Return Snapshot: The peer with the highest 1-year return is Bhagyanagar Ind at 337.26%, while MMP Industries, Divine Power, Baheti Recycling, Nupur Recyclers, and Sunlite Recycli have a 1-year return of 0.00%, marking the lowest. Onix Solar's 1-year return of 38.04% is significantly lower than Bhagyanagar Ind's but higher than the peers with zero returns. Additionally, Maan Aluminium and Onix Solar have negative six-month returns.

View full answer

How big is Onix Solar?

01-Sep-2026

As of 31st August, Onix Solar Energy Ltd has a market capitalization of 1,221.00 Cr, with recent net sales of 174.99 Cr and a net profit of 40.21 Cr. Shareholder's funds are 5.42 Cr, and total assets are valued at 39.36 Cr as of March 2025.

As of 31st August, Onix Solar Energy Ltd has a market capitalization of 1,221.00 Cr, categorizing it as a Micro Cap company.<BR><BR>In the latest four quarters, Onix Solar reported Net Sales of 174.99 Cr and a Net Profit of 40.21 Cr.<BR><BR>The latest annual period for the balance sheet is March 2025, where Shareholder's Funds amounted to 5.42 Cr and Total Assets were valued at 39.36 Cr.

View full answer

Should I buy, sell or hold Onix Solar Energy Ltd?

25-Aug-2026

Are Onix Solar latest results good or bad?

01-Dec-2025

Onix Solar's latest results show impressive revenue growth of 17,284.62% year-over-year, but declining profit margins and high valuations raise concerns about sustainability and profitability. Investors should be cautious given the stock's recent volatility and the challenges in maintaining margins.

Onix Solar's latest results present a mixed picture. On one hand, the company has demonstrated remarkable revenue growth, with net sales surging 17,284.62% year-over-year in Q2 FY26, reflecting a strong push into non-ferrous metals trading. The net profit also increased by 57.81% quarter-over-quarter to ₹1.01 crores, indicating some positive momentum.<BR><BR>However, there are significant concerns regarding profitability and sustainability. The PAT margin has decreased to 2.23% from 2.75% in the previous quarter, suggesting that while revenue is growing, the company is struggling to maintain profitability as it scales. Additionally, the operating profit margin remains low at 2.74%, down from higher levels in previous quarters.<BR><BR>The stock has faced substantial volatility, with a 19.57% decline over the past month, raising questions about its valuation, which is extremely high compared to industry peers. The price-to-earnings ratio of 248.37x and price-to-book ratio of 111.36x indicate that the market is pricing in extraordinary future growth that may be difficult to achieve.<BR><BR>In summary, while Onix Solar shows impressive revenue growth, the declining margins and extreme valuations suggest a cautious outlook. Investors should weigh the potential for continued growth against the risks of margin compression and valuation sustainability.

View full answer

How has been the historical performance of Onix Solar?

01-Dec-2025

Onix Solar experienced significant growth in the fiscal year ending March 2025, with net sales and total operating income reaching 29.39 Cr, up from 0.01 Cr in the previous year. The company reported a positive operating profit of 1.12 Cr, profit before tax of 1.52 Cr, and profit after tax of 1.45 Cr, indicating a strong financial turnaround.

Answer:<BR>The historical performance of Onix Solar shows significant growth in net sales, particularly in the fiscal year ending March 2025, where net sales reached 29.39 Cr, a substantial increase from just 0.01 Cr in March 2024. The total operating income also surged to 29.39 Cr in March 2025, compared to 0.01 Cr the previous year. Operating profit, excluding other income, improved to 1.12 Cr in March 2025 from a loss of 0.54 Cr in March 2024, indicating a positive turnaround. Profit before tax for March 2025 was 1.52 Cr, up from 0.26 Cr in March 2024, and profit after tax reached 1.45 Cr, compared to 0.21 Cr in the prior year. The earnings per share (EPS) also saw a rise to 7.32 in March 2025 from 1.06 in March 2024. <BR><BR>Breakdown:<BR>Onix Solar's financial trajectory has demonstrated remarkable improvement, particularly in the latest fiscal year. The net sales skyrocketed to 29.39 Cr in March 2025, marking a dramatic increase from the previous years, where figures were significantly lower, indicating a strong market presence. The total operating income mirrored this growth, reaching 29.39 Cr, while total expenditure, excluding depreciation, was 28.27 Cr, reflecting a well-managed cost structure. The operating profit margin turned positive at 3.81% in March 2025, a stark contrast to the negative margins observed in earlier years. Profit before tax and profit after tax also showed positive figures of 1.52 Cr and 1.45 Cr respectively, highlighting the company's ability to generate profit. The balance sheet reflects a total asset value of 39.36 Cr and total liabilities of 39.36 Cr, indicating a balanced financial position. Cash flow from operating activities was strong at 17.00 Cr, although cash flow from investing activities was negative at -19.00 Cr, leading to a net cash outflow of 2.00 Cr by March 2025. Overall, Onix Solar's financial performance indicates a significant recovery and growth trajectory in recent years.

View full answer

When is the next results date for Onix Solar?

27-Nov-2025

Onix Solar will announce its results on 29 November 2025.

Onix Solar will declare its results on 29 November 2025.

View full answer

Is Onix Solar technically bullish or bearish?

18-Nov-2025

As of November 17, 2025, Onix Solar's technical trend is bearish with moderate strength, indicated by a bearish MACD and moving averages, despite a mildly bullish signal from Bollinger Bands on the monthly chart, and a 17.1% decline over the past month reinforces this outlook.

As of 17 November 2025, the technical trend has changed from mildly bearish to bearish. The current technical stance for Onix Solar is bearish with moderate strength. Key indicators driving this stance include a bearish MACD on the weekly chart, bearish moving averages on the daily chart, and a bearish KST on the weekly chart. The Bollinger Bands indicate a mildly bullish trend on the monthly chart, but this is overshadowed by the overall bearish signals. The stock has also shown a significant decline of 17.1% over the past month, further supporting the bearish outlook.

View full answer

Is Onix Solar overvalued or undervalued?

17-Oct-2025

As of October 16, 2025, Onix Solar is considered very expensive and significantly overvalued, with a PE ratio of 315.21 and an EV to EBIT ratio of 317.14, despite a strong 1-year stock return of 270.23%, indicating a disconnect between its market price and earnings potential compared to industry peers.

As of 16 October 2025, Onix Solar's valuation grade has moved from expensive to very expensive, indicating a significant increase in perceived overvaluation. The company is currently assessed as overvalued, with a PE ratio of 315.21, an EV to EBIT ratio of 317.14, and a Price to Book Value of 141.45. These ratios starkly contrast with peers such as Hindustan Zinc, which has a PE ratio of 20.77, and Vedanta, with a PE ratio of 14.20, highlighting the extreme valuation of Onix Solar in comparison to its industry counterparts.<BR><BR>Despite its impressive return performance, with a 1-year stock return of 270.23% compared to the Sensex's 2.41%, the underlying financial metrics suggest that the company's stock price is not justified by its earnings potential. The high EV to Sales ratio of 10.28 further emphasizes the disconnect between market price and fundamental value, reinforcing the conclusion that Onix Solar is significantly overvalued in the current market environment.

View full answer

Who are the top shareholders of the Onix Solar?

17-Jul-2025

The top shareholder of Onix Solar is Gopalkumar Bhikhalal Baldha, with a 9.72% stake, while individual investors collectively hold about 84.06%. Notably, Shyamlal Prasad Shorewala is the promoter with a 0.0% holding, and there are no mutual funds or foreign institutional investors involved.

The top shareholders of Onix Solar include Gopalkumar Bhikhalal Baldha, who holds the highest public shareholding at 9.72%. The majority of the company's shares, approximately 84.06%, are held by individual investors. Additionally, Shyamlal Prasad Shorewala is noted as the promoter with the highest holding, although his stake is recorded at 0.0%. There are no mutual funds or foreign institutional investors holding shares in the company.

View full answer

Has Onix Solar declared dividend?

06-Jun-2025

No Dividend History Available

iScoreScore
Click here to find our call on this stock
Strong Sell
Sell
Hold
Buy
Strong Buy

Dashboard

1

Strong ability to service debt as the company has a low Debt to EBITDA ratio of -0.89 times

 
2

Healthy long term growth as Net Sales has grown by an annual rate of 90.90%

 
3

With a growth in Net Sales of 336.1%, the company declared Very Positive results in Mar 26

4

Risky - No result in last 6 months

stock-summaryMojo Parameters

Mojo Parameters

Loading Valuation Snapshot...

Stock DNA

stock-summary
Industry

Non - Ferrous Metals

stock-summary
Market cap

INR Cr (Micro Cap)

stock-summary
P/E

181.00

stock-summary
Industry P/E

NA

stock-summary
Dividend Yield

0.00%

stock-summary
Debt Equity

0.00

stock-summary
Return on Equity

0.00%

stock-summary
Price to Book

0.00

Revenue and Profits:
Net Sales:
70 Cr
(Quarterly Results - Mar 2026)
Net Profit:
26 Cr
stock-summaryTotal Returns
Total Returns (Price + Dividend) stock-summary
Icon
Company does not have enough history
Risk Adjusted Returns v/s stock-summary
Returns Beta
Icon
Beta has not been calculated since enough price history is not available
stock-summaryNews & Corporate Actions

News

stock-summaryKey Factors

Quality key factors stock-summary

Factor
Value
Sales Growth (5y)
90.90%
EBIT Growth (5y)
20.40%
EBIT to Interest (avg)
10.16
Debt to EBITDA (avg)
Negative Net Debt
Net Debt to Equity (avg)
-0.01
Sales to Capital Employed (avg)
1.21
Tax Ratio
32.39%
Dividend Payout Ratio
0
Pledged Shares
21.81%
Institutional Holding
0.77%
ROCE (avg)
-15.66%
ROE (avg)
24.65%

Valuation key factors

Factor
Value
P/E Ratio
181
Industry P/E
13
Price to Book Value
206.51
EV to EBIT
24.06
EV to EBITDA
24.06
EV to Capital Employed
207.85
EV to Sales
7.58
PEG Ratio
1.44
Dividend Yield
NA
ROCE (Latest)
863.70%
ROE (Latest)
113.85%

Technicals key factors

Indicator
Weekly
Monthly
MACD
Bearish
Mildly Bearish
RSI
Bullish
No Signal
Bollinger Bands
Mildly Bearish
Mildly Bearish
Moving Averages
Mildly Bullish (Daily)
KST
Mildly Bearish
Bullish
Dow Theory
Mildly Bearish
No Trend
OBV
No Trend
No Trend
stock-summary Technical Indicator Scale: Bearish, Mildly Bearish, Sideways, Mildly Bullish, Bullish  Turned 
stock-summaryShareholding
Shareholding Snapshot : Mar 2026stock-summary
Shareholding Compare (%holding) stock-summary
Majority shareholders

Promoters

Pledged Promoter Holdings

21.8057

Mutual Funds

Held by 0 Schemes

FIIs

Held by 0 FIIs

Promoter with highest holding

None

Highest Public shareholder

Onix Renewable Limited (14.29%)

Individual Investors Holdings

21.25%

stock-summaryFinancial
[
  {
    "link": "quarterly",
    "btn_text": "All Quarterly Results",
    "header": "Quarterly Results Snapshot (Standalone) - Mar'26 - QoQ",
    "rhs": [
      {
        "prefix": "Net Sales ",
        "suffix": "QoQ Growth in quarter ended Mar 2026 is 336.10% vs -62.83% in Dec 2025",
        "dir": 1
      },
      {
        "prefix": "Standalone Net Profit ",
        "suffix": "QoQ Growth in quarter ended Mar 2026 is 78.64% vs 1,990.79% in Dec 2025",
        "dir": -1
      }
    ],
    "table": {
      "header": [
        "Mar'26",
        "Dec'25",
        "Change(%)"
      ],
      "body": [
        {
          "field": "Net Sales",
          "val1": "70.30",
          "val2": "16.12",
          "chgp": "336.10%",
          "chgp_class": "positive"
        },
        {
          "field": "Operating Profit (PBDIT) excl Other Income",
          "val1": "25.42",
          "val2": "14.26",
          "chgp": "78.26%",
          "chgp_class": "positive"
        },
        {
          "field": "Interest",
          "val1": "0.04",
          "val2": "0.00",
          "chgp": "",
          "chgp_class": "neutral"
        },
        {
          "field": "Exceptional Items",
          "val1": "0.00",
          "val2": "0.00",
          "chgp": "",
          "chgp_class": "neutral"
        },
        {
          "field": "Standalone Net Profit",
          "val1": "25.67",
          "val2": "14.37",
          "chgp": "78.64%",
          "chgp_class": "positive"
        },
        {
          "field": "Operating Profit Margin (Excl OI)",
          "val1": "36.16%",
          "val2": "88.46%",
          "chgp": "-52.30%",
          "chgp_class": "negative"
        }
      ]
    }
  },
  {
    "link": "half-yearly",
    "btn_text": "All Half Yearly Results",
    "header": "Half Yearly Results Snapshot (Standalone) - Sep'25",
    "rhs": [
      {
        "prefix": "Net Sales ",
        "suffix": " Growth in half year ended Sep 2025 is 18,053.85% vs 0.00% in Sep 2024",
        "dir": 1
      },
      {
        "prefix": "Standalone Net Profit ",
        "suffix": " Growth in half year ended Sep 2025 is -126.32% vs 186.36% in Sep 2024",
        "dir": -1
      }
    ],
    "table": {
      "header": [
        "Sep'25",
        "Sep'24",
        "Change(%)"
      ],
      "body": [
        {
          "field": "Net Sales",
          "val1": "70.80",
          "val2": "0.39",
          "chgp": "18,053.85%",
          "chgp_class": "positive"
        },
        {
          "field": "Operating Profit (PBDIT) excl Other Income",
          "val1": "-17.12",
          "val2": "-0.01",
          "chgp": "-1,71,100.00%",
          "chgp_class": "negative"
        },
        {
          "field": "Interest",
          "val1": "0.07",
          "val2": "0.00",
          "chgp": "",
          "chgp_class": "neutral"
        },
        {
          "field": "Exceptional Items",
          "val1": "0.00",
          "val2": "0.00",
          "chgp": "",
          "chgp_class": "neutral"
        },
        {
          "field": "Standalone Net Profit",
          "val1": "-0.05",
          "val2": "0.19",
          "chgp": "-126.32%",
          "chgp_class": "negative"
        },
        {
          "field": "Operating Profit Margin (Excl OI)",
          "val1": "-24.18%",
          "val2": "-2.56%",
          "chgp": "-21.62%",
          "chgp_class": "negative"
        }
      ]
    }
  },
  {
    "link": "nine-monthly",
    "btn_text": "All Nine Monthly Results",
    "header": "Nine Monthly Results Snapshot (Standalone) - Dec'25",
    "rhs": [
      {
        "prefix": "Net Sales ",
        "suffix": "YoY Growth in nine months ended Dec 2025 is 50.77% vs 5,76,400.00% in Dec 2024",
        "dir": -1
      },
      {
        "prefix": "Standalone Net Profit ",
        "suffix": "YoY Growth in nine months ended Dec 2025 is 122.02% vs 1,635.71% in Dec 2024",
        "dir": -1
      }
    ],
    "table": {
      "header": [
        "Dec'25",
        "Dec'24",
        "Change(%)"
      ],
      "body": [
        {
          "field": "Net Sales",
          "val1": "86.92",
          "val2": "57.65",
          "chgp": "50.77%",
          "chgp_class": "positive"
        },
        {
          "field": "Operating Profit (PBDIT) excl Other Income",
          "val1": "-2.86",
          "val2": "5.18",
          "chgp": "-155.21%",
          "chgp_class": "negative"
        },
        {
          "field": "Interest",
          "val1": "0.07",
          "val2": "0.00",
          "chgp": "",
          "chgp_class": "neutral"
        },
        {
          "field": "Exceptional Items",
          "val1": "0.00",
          "val2": "0.00",
          "chgp": "",
          "chgp_class": "neutral"
        },
        {
          "field": "Standalone Net Profit",
          "val1": "14.32",
          "val2": "6.45",
          "chgp": "122.02%",
          "chgp_class": "positive"
        },
        {
          "field": "Operating Profit Margin (Excl OI)",
          "val1": "-3.29%",
          "val2": "8.99%",
          "chgp": "-12.28%",
          "chgp_class": "negative"
        }
      ]
    }
  },
  {
    "link": "annual",
    "btn_text": "All Annual Results",
    "header": "Annual Results Snapshot (Standalone) - Mar'26",
    "rhs": [
      {
        "prefix": "Net Sales ",
        "suffix": "YoY Growth in year ended Mar 2026 is 434.60% vs 2,93,800.00% in Mar 2025",
        "dir": -1
      },
      {
        "prefix": "Standalone Net Profit ",
        "suffix": "YoY Growth in year ended Mar 2026 is 2,671.72% vs 590.48% in Mar 2025",
        "dir": 1
      }
    ],
    "table": {
      "header": [
        "Mar'26",
        "Mar'25",
        "Change(%)"
      ],
      "body": [
        {
          "field": "Net Sales",
          "val1": "157.12",
          "val2": "29.39",
          "chgp": "434.60%",
          "chgp_class": "positive"
        },
        {
          "field": "Operating Profit (PBDIT) excl Other Income",
          "val1": "39.69",
          "val2": "1.12",
          "chgp": "3,443.75%",
          "chgp_class": "positive"
        },
        {
          "field": "Interest",
          "val1": "0.11",
          "val2": "0.00",
          "chgp": "",
          "chgp_class": "neutral"
        },
        {
          "field": "Exceptional Items",
          "val1": "0.00",
          "val2": "0.00",
          "chgp": "",
          "chgp_class": "neutral"
        },
        {
          "field": "Standalone Net Profit",
          "val1": "40.19",
          "val2": "1.45",
          "chgp": "2,671.72%",
          "chgp_class": "positive"
        },
        {
          "field": "Operating Profit Margin (Excl OI)",
          "val1": "25.26%",
          "val2": "3.81%",
          "chgp": "21.45%",
          "chgp_class": "positive"
        }
      ]
    }
  }
]

Quarterly Results Snapshot (Standalone) - Mar'26 - QoQstock-summary

Mar'26
Dec'25
Change(%)
Net Sales
70.30
16.12
336.10%
Operating Profit (PBDIT) excl Other Income
25.42
14.26
78.26%
Interest
0.04
0.00
Exceptional Items
0.00
0.00
Standalone Net Profit
25.67
14.37
78.64%
Operating Profit Margin (Excl OI)
36.16%
88.46%
-52.30%
Values in Rs Cr.
Direction Arrows
Net Sales

QoQ Growth in quarter ended Mar 2026 is 336.10% vs -62.83% in Dec 2025

Direction Arrows
Standalone Net Profit

QoQ Growth in quarter ended Mar 2026 is 78.64% vs 1,990.79% in Dec 2025

Half Yearly Results Snapshot (Standalone) - Sep'25stock-summary

Sep'25
Sep'24
Change(%)
Net Sales
70.80
0.39
18,053.85%
Operating Profit (PBDIT) excl Other Income
-17.12
-0.01
-1,71,100.00%
Interest
0.07
0.00
Exceptional Items
0.00
0.00
Standalone Net Profit
-0.05
0.19
-126.32%
Operating Profit Margin (Excl OI)
-24.18%
-2.56%
-21.62%
Values in Rs Cr.
Direction Arrows
Net Sales

Growth in half year ended Sep 2025 is 18,053.85% vs 0.00% in Sep 2024

Direction Arrows
Standalone Net Profit

Growth in half year ended Sep 2025 is -126.32% vs 186.36% in Sep 2024

Nine Monthly Results Snapshot (Standalone) - Dec'25stock-summary

Dec'25
Dec'24
Change(%)
Net Sales
86.92
57.65
50.77%
Operating Profit (PBDIT) excl Other Income
-2.86
5.18
-155.21%
Interest
0.07
0.00
Exceptional Items
0.00
0.00
Standalone Net Profit
14.32
6.45
122.02%
Operating Profit Margin (Excl OI)
-3.29%
8.99%
-12.28%
Values in Rs Cr.
Direction Arrows
Net Sales

YoY Growth in nine months ended Dec 2025 is 50.77% vs 5,76,400.00% in Dec 2024

Direction Arrows
Standalone Net Profit

YoY Growth in nine months ended Dec 2025 is 122.02% vs 1,635.71% in Dec 2024

Annual Results Snapshot (Standalone) - Mar'26stock-summary

Mar'26
Mar'25
Change(%)
Net Sales
157.12
29.39
434.60%
Operating Profit (PBDIT) excl Other Income
39.69
1.12
3,443.75%
Interest
0.11
0.00
Exceptional Items
0.00
0.00
Standalone Net Profit
40.19
1.45
2,671.72%
Operating Profit Margin (Excl OI)
25.26%
3.81%
21.45%
Values in Rs Cr.
Direction Arrows
Net Sales

YoY Growth in year ended Mar 2026 is 434.60% vs 2,93,800.00% in Mar 2025

Direction Arrows
Standalone Net Profit

YoY Growth in year ended Mar 2026 is 2,671.72% vs 590.48% in Mar 2025

stock-summaryCompany CV
About Onix Solar Energy Ltd stock-summary
stock-summary
Onix Solar Energy Ltd
Micro Cap
Non - Ferrous Metals
ABC Gas (International) Limited, formerly known as Brassco Extrusions Limited was incorporated in 1980 is presently engaged in the business of Trading in Non Ferrous Metals. The Company was a leading manufacturer piped gas of brass rods & tubes and copper pipes. With a strategically located warehouse on the outskirts of Mumbai (Dombivli), the Company has the single largest stock point for gas reticulated products in India.
Company Coordinates stock-summary
Company Details
1 Mahesh Villa B G Kher Road, Worli Mumbai Maharashtra : 400018
stock-summary
Tel: 91-022-24935508/24938697
stock-summary
swati@abcgas.co.in
Registrar Details
Sharex (India) Pvt Ltd , Unit No.1, Luthra Ind.Premises Andheri Kurla Road, Safed Pool , Mumbai