
Compare OnMobile Global with Similar Stocks
Dashboard
Poor long term growth as Net Sales has grown by an annual rate of -1.28% and Operating profit at -201.15% over the last 5 years
- PAT(Q) At Rs -36.55 cr has Fallen at -925.9% (vs previous 4Q average)
- DEBT-EQUITY RATIO(HY) Highest at 0.12 times
- OPERATING PROFIT TO INTEREST (Q) Lowest at -22.83 times
Risky - Negative EBITDA
Falling Participation by Institutional Investors
Consistent Underperformance against the benchmark over the last 3 years
Stock DNA
Media & Entertainment
INR 527 Cr (Micro Cap)
NA (Loss Making)
20
0.00%
-0.10
-1.75%
0.83
Total Returns (Price + Dividend) 
Latest dividend: 1.5 per share ex-dividend date: Sep-14-2022
Risk Adjusted Returns v/s
Returns Beta

News

OnMobile Global Ltd Technical Momentum Shifts Amid Bearish Signals
OnMobile Global Ltd, a micro-cap player in the Media & Entertainment sector, has experienced a notable shift in its technical momentum, moving from a sideways trend to a mildly bearish stance. Despite some bullish signals on weekly charts, monthly indicators reveal caution, reflecting a complex technical landscape for investors to navigate.
Read full news article
OnMobile Global Ltd is Rated Strong Sell
OnMobile Global Ltd is rated Strong Sell by MarketsMOJO, with this rating last updated on 19 May 2026. However, the analysis and financial metrics discussed here reflect the stock's current position as of 03 June 2026, providing investors with the latest insights into the company’s performance and outlook.
Read full news article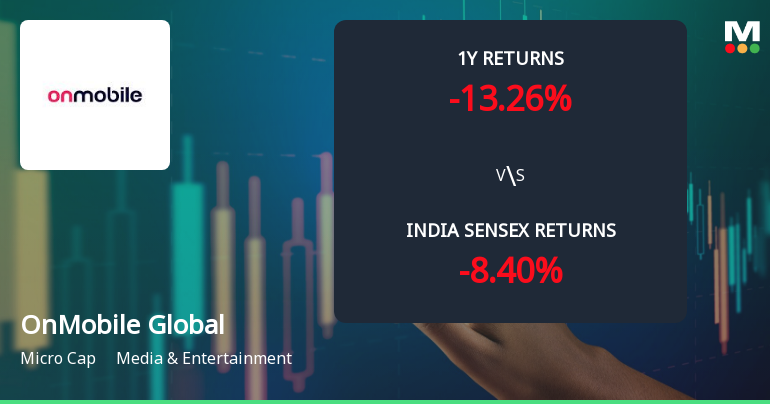
OnMobile Global Ltd Technical Momentum Shifts Amid Bearish Sentiment
OnMobile Global Ltd, a micro-cap player in the Media & Entertainment sector, has experienced a subtle shift in its technical momentum, signalling a transition from a sideways trend to a mildly bearish stance. Despite some bullish cues from weekly and monthly MACD and KST indicators, the overall technical landscape suggests caution for investors as the stock grapples with downward pressure and underperformance relative to benchmarks like the Sensex.
Read full news article Announcements
Announcement under Regulation 30 (LODR)-Earnings Call Transcript
25-May-2026 | Source : BSEThe Company has informed the exchange about Transcript of Investors Conference Call for Q4FY26.
Announcement under Regulation 30 (LODR)-Newspaper Publication
20-May-2026 | Source : BSEOnMobile Global Limited has informed the Exchange about newspaper publication pertaining to the audited financial results of the Company for the quarter and year ended March 31 2026. The advertisement was published on Financial Express and Hosadigantha on May 20 2026 and hosted on the Companys website at www.onmobile.com.
Announcement under Regulation 30 (LODR)-Change in Management
18-May-2026 | Source : BSEThe Board of Directors of OnMobile Global Limited (the Company) at its meeting held on May 18 2026 has considered and approved appointment of Leo Matthew Olebe (DIN: 11698973) as an Additional Director in the category of Independent Director.
Corporate Actions

No Upcoming Board Meetings

OnMobile Global Ltd has declared 15% dividend, ex-date: 14 Sep 22

No Splits history available

OnMobile Global Ltd has announced 1:1 bonus issue, ex-date: 03 May 11

No Rights history available
Quality key factors
Valuation key factors
Technicals key factors
 Technical Indicator Scale: Bearish, Mildly Bearish, Sideways, Mildly Bullish, Bullish Turned
 Shareholding Snapshot : Mar 2026
Shareholding Compare (%holding)
Non Institution
None
Held by 0 Schemes
Held by 15 FIIs (0.17%)
Onmobile Systems Inc (47.9%)
Ajay Upadhyaya (1.74%)
44.55%
Quarterly Results Snapshot (Consolidated) - Mar'26 - QoQ

QoQ Growth in quarter ended Mar 2026 is -5.91% vs 5.88% in Dec 2025
QoQ Growth in quarter ended Mar 2026 is -1,120.95% vs -40.43% in Dec 2025
Half Yearly Results Snapshot (Consolidated) - Sep'25

Growth in half year ended Sep 2025 is 0.27% vs -6.66% in Sep 2024
Growth in half year ended Sep 2025 is 179.86% vs -248.01% in Sep 2024
Nine Monthly Results Snapshot (Consolidated) - Dec'25
YoY Growth in nine months ended Dec 2025 is -6.63% vs 6.72% in Dec 2024
YoY Growth in nine months ended Dec 2025 is 178.36% vs -303.86% in Dec 2024
Annual Results Snapshot (Consolidated) - Mar'26
YoY Growth in year ended Mar 2026 is -9.80% vs 11.65% in Mar 2025
YoY Growth in year ended Mar 2026 is 71.94% vs -363.58% in Mar 2025
About OnMobile Global Ltd

Company Coordinates


