
Compare Optiemus Infra with Similar Stocks
Dashboard
Poor Management Efficiency with a low ROCE of 6.39%
- The company has been able to generate a Return on Capital Employed (avg) of 6.39% signifying low profitability per unit of total capital (equity and debt)
Negative results in Mar 26
With ROCE of 6.6, it has a Expensive valuation with a 4 Enterprise value to Capital Employed
Underperformed the market in the last 1 year
Stock DNA
Telecom - Equipment & Accessories
INR 4,465 Cr (Small Cap)
62.00
23
0.00%
0.43
8.50%
5.31
Total Returns (Price + Dividend) 
Latest dividend: 1.4980293409240204 per share ex-dividend date: Jun-07-2023
Risk Adjusted Returns v/s
Returns Beta

News
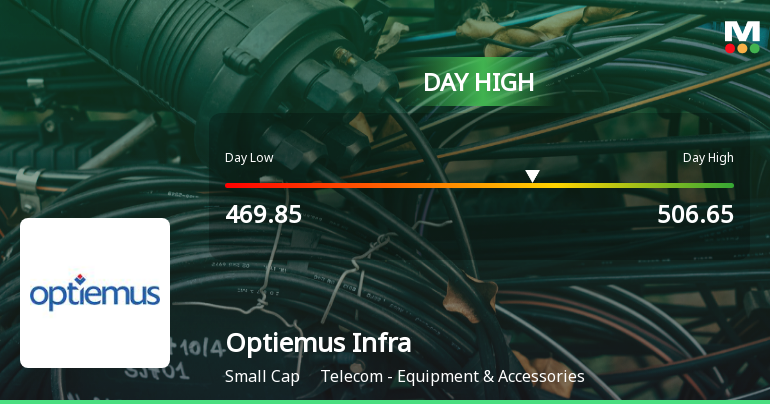
Optiemus Infracom Ltd Surges 8.41% to Day's High of Rs 500.5 — Outperforms Sector by 6.72 Percentage Points
The Sensex advanced 0.33% on 1 Jul 2026, yet Optiemus Infracom Ltd outpaced both the benchmark and its sector with an 8.41% gain, reaching an intraday peak of Rs 500.5. This 6.72-percentage-point outperformance signals a distinctly stock-specific rally rather than a market-wide lift.
Read full news article
Optiemus Infracom Ltd Downgraded to Strong Sell Amid Valuation and Technical Weakness
Optiemus Infracom Ltd, a small-cap player in the Telecom - Equipment & Accessories sector, has seen its investment rating downgraded from Sell to Strong Sell as of 29 June 2026. This shift reflects deteriorating technical indicators, an expensive valuation profile, weakening financial trends, and subdued quality metrics, signalling caution for investors amid mixed market performance and operational challenges.
Read full news article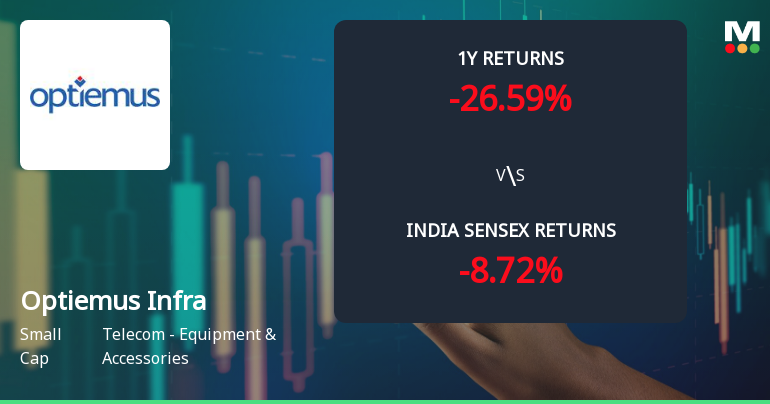
Optiemus Infracom Ltd Technical Momentum Shifts Amid Mixed Indicator Signals
Optiemus Infracom Ltd, a small-cap player in the Telecom Equipment & Accessories sector, has experienced a notable shift in its technical momentum, moving from a sideways trend to a mildly bearish stance. Despite a modest day gain of 0.55%, the stock’s technical indicators present a complex picture, with mixed signals from MACD, RSI, moving averages, and other momentum oscillators, suggesting cautious investor sentiment amid broader market dynamics.
Read full news article Announcements
Optiemus Infracom Limited - Updates
18-Nov-2019 | Source : NSEOptiemus Infracom Limited has informed the Exchange regarding 'Change in Authorized Key Managerial Personnel for determining materiality of an event/information in terms of Reg. 30(5) of SEBI (LODR) Regulations 2015'.
Optiemus Infracom Limited - Press Release
06-Nov-2019 | Source : NSEOptiemus Infracom Limited has informed the Exchange regarding a press release dated November 05, 2019, titled "Submission of copies of Newspaper Advertisement regarding Intimation of Board Meeting".
Optiemus Infracom Limited - Updates
22-Oct-2019 | Source : NSEOptiemus Infracom Limited has informed the Exchange regarding 'Compliance Certificate under Regulation 7(3) of SEBI (Listing Obligations and Disclosure Requirements) Regulations, 2015 for the half year ended on 30th September, 2019'.
Corporate Actions

No Upcoming Board Meetings

Optiemus Infracom Ltd has declared 15% dividend, ex-date: 07 Jun 23

No Splits history available

No Bonus history available

No Rights history available
Quality key factors
Valuation key factors
Technicals key factors
 Technical Indicator Scale: Bearish, Mildly Bearish, Sideways, Mildly Bullish, Bullish Turned
 Shareholding Snapshot : Mar 2026
Shareholding Compare (%holding)
Promoters
0.4687
Held by 6 Schemes (1.36%)
Held by 21 FIIs (2.86%)
Gra Enterprises Private Limited (43.68%)
Bofa Securities Europe Sa - Odi (1.22%)
16.2%
Quarterly Results Snapshot (Consolidated) - Mar'26 - QoQ

QoQ Growth in quarter ended Mar 2026 is 12.78% vs 2.81% in Dec 2025
QoQ Growth in quarter ended Mar 2026 is 83.73% vs -27.12% in Dec 2025
Half Yearly Results Snapshot (Consolidated) - Sep'25

Growth in half year ended Sep 2025 is -11.93% vs 74.35% in Sep 2024
Growth in half year ended Sep 2025 is 21.03% vs 74.92% in Sep 2024
Nine Monthly Results Snapshot (Consolidated) - Dec'25
YoY Growth in nine months ended Dec 2025 is -10.90% vs 38.85% in Dec 2024
YoY Growth in nine months ended Dec 2025 is 6.53% vs 24.91% in Dec 2024
Annual Results Snapshot (Consolidated) - Mar'26
YoY Growth in year ended Mar 2026 is -6.42% vs 23.71% in Mar 2025
YoY Growth in year ended Mar 2026 is 4.23% vs 11.58% in Mar 2025
About Optiemus Infracom Ltd

Company Coordinates


