
Compare Optimus Finance with Similar Stocks
Stock DNA
Non Banking Financial Company (NBFC)
INR 104 Cr (Micro Cap)
19.00
20
0.00%
0.59
8.74%
1.48
Total Returns (Price + Dividend) 
Optimus Finance for the last several years.
Risk Adjusted Returns v/s
Returns Beta

News
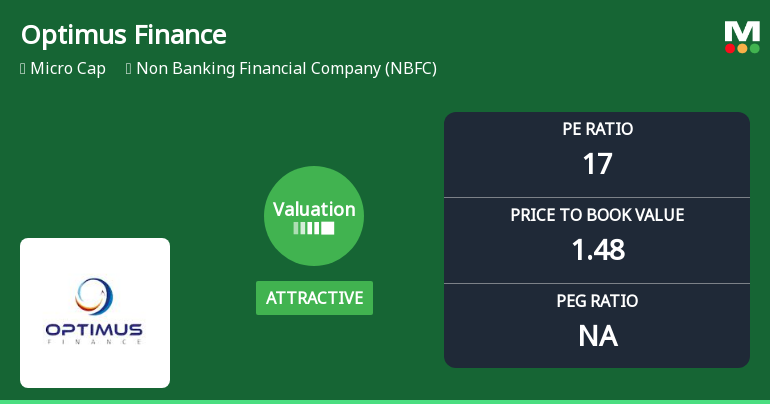
Optimus Finance Ltd Valuation Shifts Signal Changing Market Sentiment
Optimus Finance Ltd, a micro-cap player in the Non Banking Financial Company (NBFC) sector, has witnessed a notable shift in its valuation parameters, moving from a very attractive to an attractive rating. Despite a recent upgrade in valuation grade, the company’s overall market sentiment remains cautious, reflected in its Strong Sell Mojo Grade and subdued returns compared to the Sensex over the past year.
Read full news article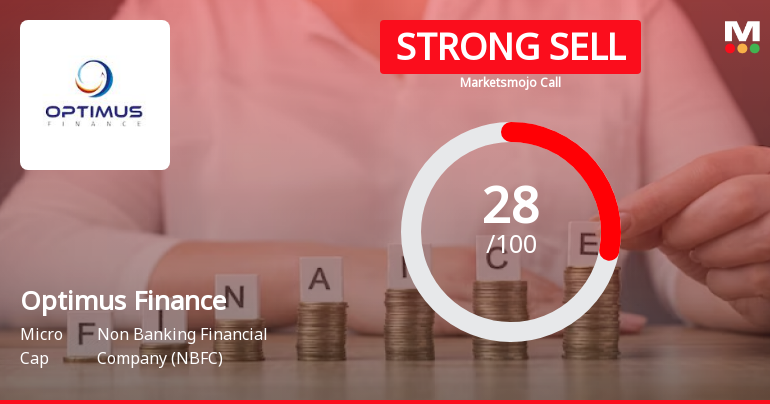
Optimus Finance Ltd is Rated Strong Sell
Optimus Finance Ltd is rated Strong Sell by MarketsMOJO, with this rating last updated on 14 Oct 2025. However, the analysis and financial metrics discussed here reflect the company’s current position as of 02 June 2026, providing investors with an up-to-date view of the stock’s fundamentals, valuation, financial trend, and technical outlook.
Read full news article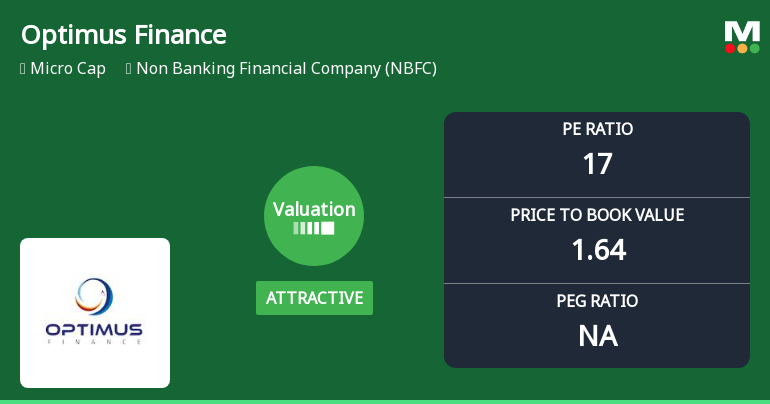
Optimus Finance Ltd Valuation Shifts Signal Renewed Price Attractiveness Amid Market Volatility
Optimus Finance Ltd, a micro-cap player in the Non Banking Financial Company (NBFC) sector, has witnessed a notable shift in its valuation parameters, moving from fair to attractive territory. Despite recent share price declines and a strong sell Mojo Grade, the company’s price-to-earnings (P/E) and price-to-book value (P/BV) ratios suggest a potential value opportunity for discerning investors amid broader market challenges.
Read full news article Announcements
Compliances-Reg.24(A)-Annual Secretarial Compliance
30-May-2026 | Source : BSESubmission of Annual Secretarial Compliance Report for the Financial Year ended 31st March 2026 (2025-26).
Announcement under Regulation 30 (LODR)-Newspaper Publication
30-May-2026 | Source : BSEPublication of Extract of Audited Financial Results for the Fourth Quarter and Financial Year ended 31st March 2026 in Newspapers.
Clarification On Price Movement.
21-May-2026 | Source : BSEClarification On Price Movement.
Corporate Actions

No Upcoming Board Meetings

No Dividend history available

Optimus Finance Ltd has announced 1:10 stock split, ex-date: 21 Mar 25

No Bonus history available

No Rights history available
Quality key factors
Valuation key factors
Technicals key factors
 Technical Indicator Scale: Bearish, Mildly Bearish, Sideways, Mildly Bullish, Bullish Turned
 Shareholding Snapshot : Mar 2026
Shareholding Compare (%holding)
Promoters
None
Held by 0 Schemes
Held by 0 FIIs
Sukruti Infratech Private Limited (53.89%)
Lecorp Corporate Services Llp (4.95%)
25.92%
Quarterly Results Snapshot (Consolidated) - Mar'26 - QoQ

QoQ Growth in quarter ended Mar 2026 is 28.72% vs -5.16% in Dec 2025
QoQ Growth in quarter ended Mar 2026 is 12.90% vs -27.91% in Dec 2025
Half Yearly Results Snapshot (Consolidated) - Sep'25

Growth in half year ended Sep 2025 is 13.43% vs 62.94% in Sep 2024
Growth in half year ended Sep 2025 is 11.27% vs 62.29% in Sep 2024
Nine Monthly Results Snapshot (Consolidated) - Dec'25
YoY Growth in nine months ended Dec 2025 is 14.69% vs 55.66% in Dec 2024
YoY Growth in nine months ended Dec 2025 is -4.35% vs 32.18% in Dec 2024
Annual Results Snapshot (Consolidated) - Mar'26
YoY Growth in year ended Mar 2026 is 17.48% vs 44.05% in Mar 2025
YoY Growth in year ended Mar 2026 is -0.17% vs 10.46% in Mar 2025
About Optimus Finance Ltd

Company Coordinates


