
Compare Orchasp Ltd with Similar Stocks
Dashboard
With a Operating Losses, the company has a Weak Long Term Fundamental Strength
- Company's ability to service its debt is weak with a poor EBIT to Interest (avg) ratio of -3.31
- The company has been able to generate a Return on Equity (avg) of 0.41% signifying low profitability per unit of shareholders funds
With a fall in Net Sales of -77.03%, the company declared Very Negative results in Mar 26
Risky - Negative EBITDA
Below par performance in long term as well as near term
Stock DNA
Computers - Software & Consulting
INR 70 Cr (Micro Cap)
60.00
20
0.00%
0.00
0.86%
0.52
Total Returns (Price + Dividend) 
Orchasp Ltd for the last several years.
Risk Adjusted Returns v/s
Returns Beta

News
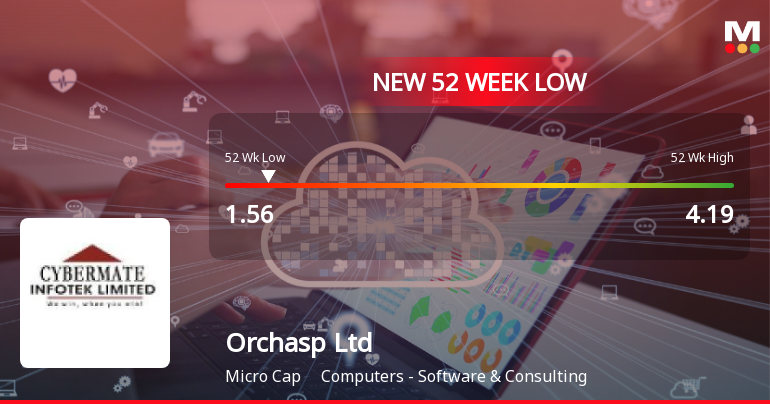
Orchasp Ltd Falls to 52-Week Low of Rs 1.56 as Sell-Off Deepens
For the second consecutive session, Orchasp Ltd has extended its decline, hitting a fresh 52-week low of Rs 1.56 on 17 Jun 2026, marking a 6.32% drop on the day and underperforming its sector by 9.32%. This latest fall brings the stock down nearly 38% over the past year, significantly lagging the Sensex’s modest 5.49% decline over the same period.
Read full news article
Orchasp Ltd is Rated Strong Sell
Orchasp Ltd is rated Strong Sell by MarketsMOJO, with this rating last updated on 29 May 2026. However, the analysis and financial metrics discussed here reflect the company’s current position as of 17 June 2026, providing investors with the latest insights into its performance and outlook.
Read full news article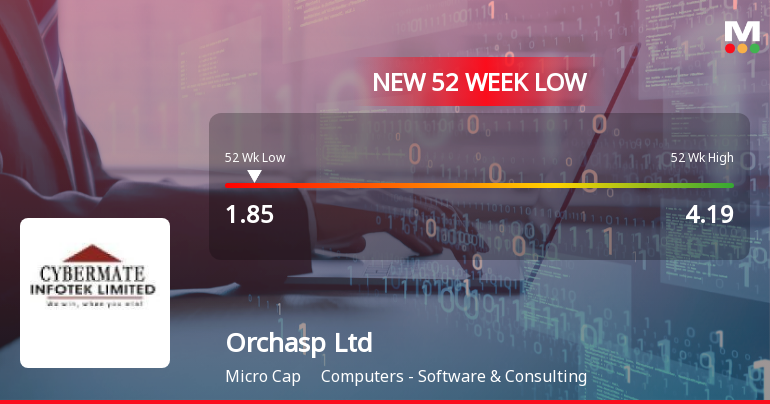
Orchasp Ltd Falls to 52-Week Low of Rs 1.85 as Sell-Off Deepens
A sharp decline has pushed Orchasp Ltd to a fresh 52-week low of Rs 1.85 on 11 Jun 2026, marking a 33.78% drop over the past year and signalling sustained pressure on this micro-cap software company despite a recovering broader market.
Read full news article Announcements
Corporate Actions

No Upcoming Board Meetings

No Dividend history available

No Splits history available

No Bonus history available

No Rights history available
Quality key factors
Valuation key factors
Technicals key factors
 Technical Indicator Scale: Bearish, Mildly Bearish, Sideways, Mildly Bullish, Bullish Turned
 Shareholding Snapshot : Mar 2026
Shareholding Compare (%holding)
Non Institution
None
Held by 0 Schemes
Held by 0 FIIs
Ms.rajeswari Pattapurathi (16.16%)
Nova Global Opportunities Fund Pcc - Touchstone (12.46%)
43.56%
Quarterly Results Snapshot (Consolidated) - Mar'26 - YoY

YoY Growth in quarter ended Mar 2026 is -77.03% vs 100.29% in Mar 2025
YoY Growth in quarter ended Mar 2026 is -96.36% vs 30,100.00% in Mar 2025
Half Yearly Results Snapshot (Consolidated) - Sep'25

Growth in half year ended Sep 2025 is 89.70% vs 23.62% in Sep 2024
Growth in half year ended Sep 2025 is 105.34% vs -2,481.36% in Sep 2024
Nine Monthly Results Snapshot (Consolidated) - Dec'25
YoY Growth in nine months ended Dec 2025 is 39.59% vs 41.55% in Dec 2024
YoY Growth in nine months ended Dec 2025 is 106.94% vs -1,675.58% in Dec 2024
Annual Results Snapshot (Consolidated) - Mar'26
YoY Growth in year ended Mar 2026 is 0.85% vs 59.09% in Mar 2025
YoY Growth in year ended Mar 2026 is 109.98% vs -1,647.06% in Mar 2025
About Orchasp Ltd

Company Coordinates


