
Compare Orchasp Ltd with Similar Stocks
Dashboard
With a Operating Losses, the company has a Weak Long Term Fundamental Strength
- Company's ability to service its debt is weak with a poor EBIT to Interest (avg) ratio of -3.31
- The company has been able to generate a Return on Equity (avg) of 0.41% signifying low profitability per unit of shareholders funds
With a fall in Net Sales of -77.03%, the company declared Very Negative results in Mar 26
Risky - Negative EBITDA
Consistent Underperformance against the benchmark over the last 3 years
Stock DNA
Computers - Software & Consulting
INR 58 Cr (Micro Cap)
54.00
21
0.00%
0.00
0.86%
0.47
Total Returns (Price + Dividend) 
Orchasp Ltd for the last several years.
Risk Adjusted Returns v/s
Returns Beta

News
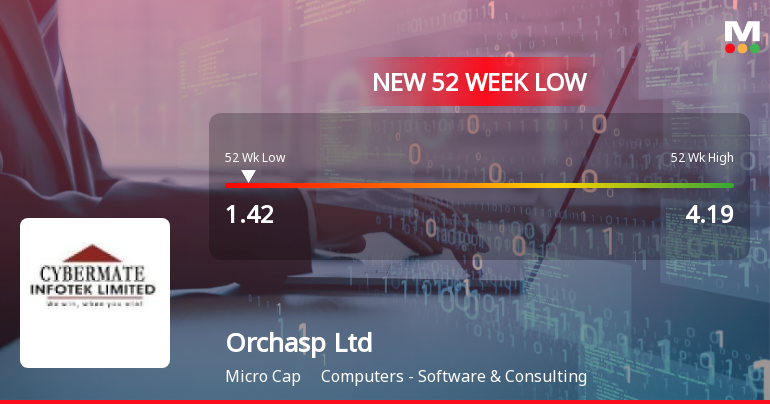
Orchasp Ltd Falls to 52-Week Low of Rs 1.42 as Sell-Off Deepens
A sharp decline of 8.33% today dragged Orchasp Ltd to a fresh 52-week low of Rs 1.42, extending a downward trajectory that has seen the stock lose nearly half its value over the past year.
Read full news article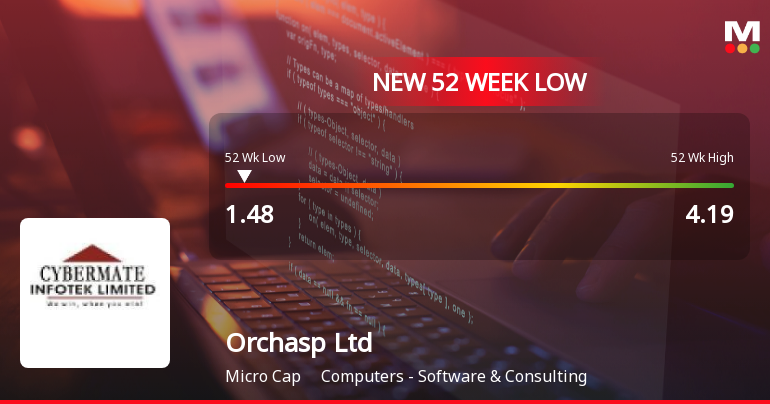
Orchasp Ltd Falls to 52-Week Low of Rs 1.48 as Sell-Off Deepens
A sharp decline of 7.56% in today's trading session dragged Orchasp Ltd to a fresh 52-week low of Rs 1.48, extending its downward trajectory amid broader market weakness and company-specific concerns.
Read full news article
Orchasp Ltd is Rated Strong Sell
Orchasp Ltd is rated Strong Sell by MarketsMOJO, with this rating last updated on 29 May 2026. However, the analysis and financial metrics presented here reflect the stock's current position as of 21 July 2026, providing investors with the latest insights into the company’s performance and outlook.
Read full news article Announcements
Compliances-Certificate under Reg. 74 (5) of SEBI (DP) Regulations 2018
07-Jul-2026 | Source : BSEIntimation attached
Closure of Trading Window
24-Jun-2026 | Source : BSEIntimation attached
Compliances-Reg.24(A)-Annual Secretarial Compliance
30-May-2026 | Source : BSEAnnual Secretarial compliance report for the FY 2025-26
Corporate Actions

No Upcoming Board Meetings

No Dividend history available

No Splits history available

No Bonus history available

No Rights history available
Quality key factors
Valuation key factors
Technicals key factors
 Technical Indicator Scale: Bearish, Mildly Bearish, Sideways, Mildly Bullish, Bullish Turned
 Shareholding Snapshot : Mar 2026
Shareholding Compare (%holding)
Non Institution
None
Held by 0 Schemes
Held by 0 FIIs
Ms.rajeswari Pattapurathi (16.16%)
Nova Global Opportunities Fund Pcc - Touchstone (12.46%)
43.56%
Quarterly Results Snapshot (Consolidated) - Mar'26 - YoY

YoY Growth in quarter ended Mar 2026 is -77.03% vs 100.29% in Mar 2025
YoY Growth in quarter ended Mar 2026 is -96.36% vs 30,100.00% in Mar 2025
Half Yearly Results Snapshot (Consolidated) - Sep'25

Growth in half year ended Sep 2025 is 89.70% vs 23.62% in Sep 2024
Growth in half year ended Sep 2025 is 105.34% vs -2,481.36% in Sep 2024
Nine Monthly Results Snapshot (Consolidated) - Dec'25
YoY Growth in nine months ended Dec 2025 is 39.59% vs 41.55% in Dec 2024
YoY Growth in nine months ended Dec 2025 is 106.94% vs -1,675.58% in Dec 2024
Annual Results Snapshot (Consolidated) - Mar'26
YoY Growth in year ended Mar 2026 is 0.85% vs 59.09% in Mar 2025
YoY Growth in year ended Mar 2026 is 109.98% vs -1,647.06% in Mar 2025
About Orchasp Ltd

Company Coordinates


