
Compare Organic Coatings with Similar Stocks
Dashboard
With HIgh Debt (Debt-Equity Ratio at 9.19 times)- the company has a Weak Long Term Fundamental Strength
- Poor long term growth as Operating profit has grown by an annual rate -186.56% of over the last 5 years
- High Debt Company with a Debt to Equity ratio (avg) of 6.82 times
- The company has reported losses. Due to this company has reported negative ROE
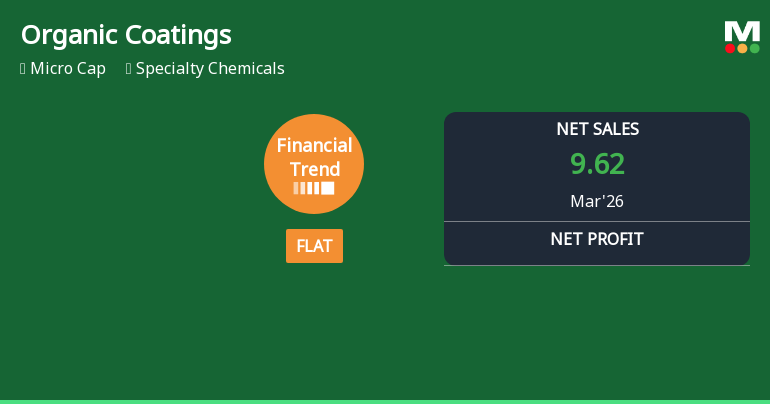
Flat results in Mar 26
Risky - Negative EBITDA
Stock DNA
Specialty Chemicals
INR 17 Cr (Micro Cap)
NA (Loss Making)
18
0.00%
9.19
-326.00%
16.54
Total Returns (Price + Dividend) 
Latest dividend: 0.5 per share ex-dividend date: Sep-16-2010
Risk Adjusted Returns v/s
Returns Beta

News
Organic Coatings Ltd Reports Flat Quarterly Performance Amid Margin Pressures
Organic Coatings Ltd, a micro-cap player in the Specialty Chemicals sector, has reported a flat financial performance for the quarter ended March 2026, signalling a pause in its previously positive growth trajectory. Despite achieving its highest quarterly net sales to date, the company continues to grapple with deteriorating profitability and operational efficiency, prompting a downgrade to a Strong Sell rating by MarketsMOJO.
Read full news articleAre Organic Coatings Ltd latest results good or bad?
Organic Coatings Ltd's latest financial results reflect a complex operational landscape characterized by persistent challenges. In the quarter ending March 2026, the company reported net sales of ₹9.62 crores, which represents a significant quarter-on-quarter growth of 63.88% compared to ₹5.87 crores in the previous quarter. However, this revenue growth has not translated into profitability, as the company recorded a net loss of ₹0.85 crores, marking the seventh consecutive quarter of operating losses. The operating margin, excluding other income, was reported at -4.99%, showing a slight improvement from -9.88% in the previous quarter, yet it remains deeply negative. This indicates ongoing difficulties in achieving positive operating leverage despite the uptick in sales. The company's full-year results for FY26 show a modest increase in net sales to ₹28.09 crores, a 7.70% rise from FY25, but this was overs...
Read full news article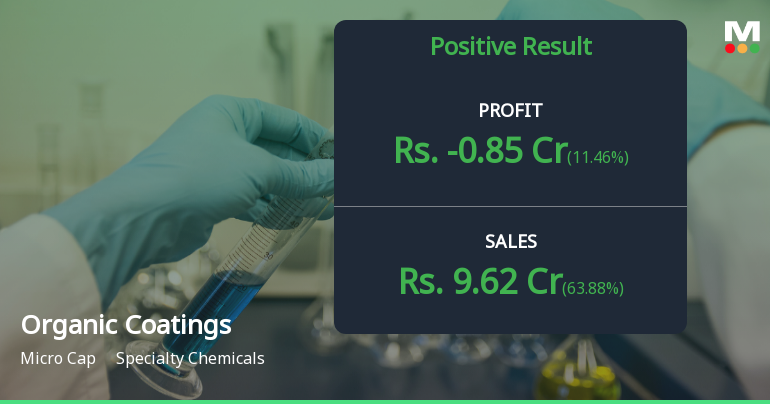
Organic Coatings Q4 FY26: Deepening Losses Amid Revenue Surge Raise Serious Viability Concerns
Organic Coatings Ltd., a micro-cap specialty chemicals manufacturer engaged in printing inks and industrial coatings, reported a net loss of ₹0.85 crores for Q4 FY26, remaining virtually unchanged from the ₹0.78 crores loss recorded in Q4 FY25. Despite a robust 51.50% year-on-year revenue surge to ₹9.62 crores, the company's inability to translate top-line growth into bottom-line improvement underscores severe operational inefficiencies and structural profitability challenges that have plagued the organisation for multiple consecutive quarters.
Read full news article Announcements
Announcement under Regulation 30 (LODR)-Newspaper Publication
01-Jun-2026 | Source : BSEDisclosure under Regulation 30 & 47 of Securities & Exchange Board of India (Listing Operations and Disclosure Requirements) Regulations 2015
Announcement under Regulation 30 (LODR)-Resignation of Company Secretary / Compliance Officer
30-May-2026 | Source : BSEResignation of Mrs. Nivedita Kulkarni Company Secretary & Compliance Officer
Board Meeting Outcome for Outcome Of Board Meeting
30-May-2026 | Source : BSEOutcome of board meeting held on 30.05.26
Corporate Actions

No Upcoming Board Meetings

Organic Coatings Ltd has declared 5% dividend, ex-date: 16 Sep 10

No Splits history available

No Bonus history available

No Rights history available
Quality key factors
Valuation key factors
Technicals key factors
 Technical Indicator Scale: Bearish, Mildly Bearish, Sideways, Mildly Bullish, Bullish Turned
 Shareholding Snapshot : Mar 2026
Shareholding Compare (%holding)
Non Institution
None
Held by 0 Schemes
Held by 0 FIIs
Manoj Vasantlal Mehta (2.31%)
Nikhil Sadarangani . (11.75%)
80.19%
Quarterly Results Snapshot (Standalone) - Mar'26 - QoQ

QoQ Growth in quarter ended Mar 2026 is 63.88% vs 6.15% in Dec 2025
QoQ Growth in quarter ended Mar 2026 is 11.46% vs -60.00% in Dec 2025
Half Yearly Results Snapshot (Standalone) - Sep'25

Growth in half year ended Sep 2025 is -34.39% vs 64.41% in Sep 2024
Growth in half year ended Sep 2025 is -229.55% vs 6.38% in Sep 2024
Nine Monthly Results Snapshot (Standalone) - Dec'25
YoY Growth in nine months ended Dec 2025 is -18.27% vs 27.02% in Dec 2024
YoY Growth in nine months ended Dec 2025 is -81.20% vs -90.00% in Dec 2024
Annual Results Snapshot (Standalone) - Mar'26
YoY Growth in year ended Mar 2026 is -3.00% vs 7.94% in Mar 2025
YoY Growth in year ended Mar 2026 is -55.24% vs -346.81% in Mar 2025
About Organic Coatings Ltd

Company Coordinates


