
Compare Organon & Co. with Similar Stocks
Dashboard
Company has a low Debt to Equity ratio (avg) at times
Healthy long term growth as Net Sales has grown by an annual rate of 13.72% and Operating profit at -3.44%
Negative results in Jun 25
With ROE of 163.16%, it has a very attractive valuation with a 4.59 Price to Book Value
Below par performance in long term as well as near term
Stock DNA
Pharmaceuticals & Biotechnology
USD 2,493 Million (Small Cap)
3.00
NA
0.62%
9.00
63.13%
2.75
Total Returns (Price + Dividend) 
Organon & Co. for the last several years.
Risk Adjusted Returns v/s
News
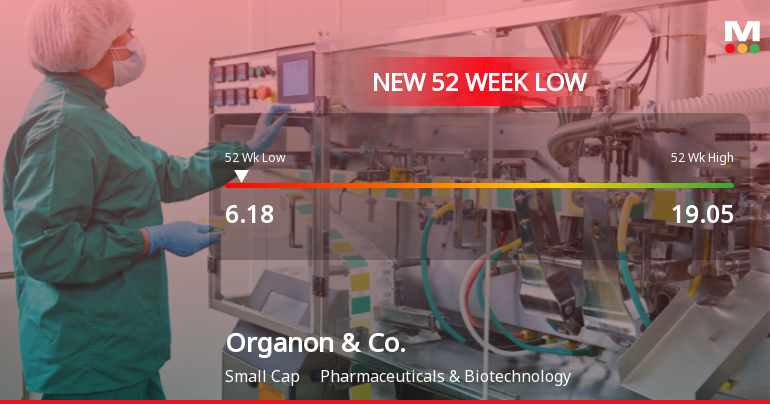
Organon & Co. Stock Plummets to New 52-Week Low of $6.18
Organon & Co. has hit a new 52-week low, reflecting a challenging year with a significant stock price decline. The company has a market capitalization of USD 2,722 million, a low P/E ratio, and a high return on equity, but faces operational difficulties and increased costs.
Read full news article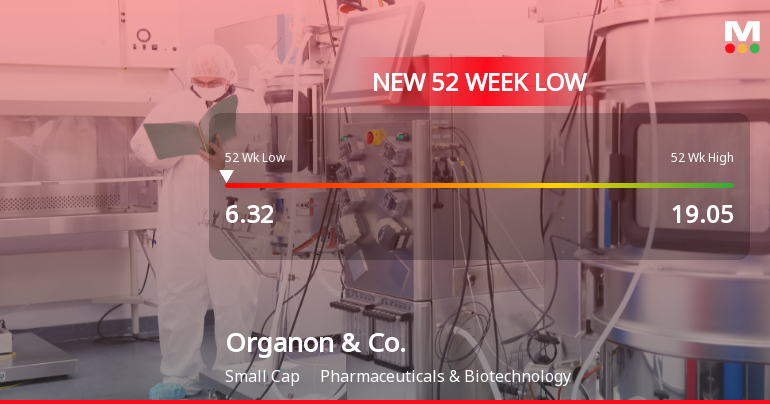
Organon & Co. Hits New 52-Week Low at USD 6.32 Amid Decline
Organon & Co. has reached a new 52-week low, reflecting a challenging year with a significant stock price decline. The company has a market capitalization of USD 2,722 million, a low P/E ratio, and reports a decrease in net profit alongside rising raw material costs, indicating ongoing financial struggles.
Read full news article Announcements

Corporate Actions
Quality key factors
Valuation key factors
Technicals key factors
 Technical Indicator Scale: Bearish, Mildly Bearish, Sideways, Mildly Bullish, Bullish Turned
 Shareholding Snapshot : Sep 2025
Shareholding Compare (%holding)
Domestic Funds
Held in 103 Schemes (45.63%)
Held by 221 Foreign Institutions (11.14%)
Quarterly Results Snapshot (Consolidated) - Sep'25 - QoQ

QoQ Growth in quarter ended Sep 2025 is 0.50% vs 5.35% in Jun 2025
QoQ Growth in quarter ended Sep 2025 is 10.34% vs 66.67% in Jun 2025
Annual Results Snapshot (Consolidated) - Dec'24

YoY Growth in year ended Dec 2024 is 2.24% vs 1.44% in Dec 2023
YoY Growth in year ended Dec 2024 is -15.54% vs 11.56% in Dec 2023
About Organon & Co.

Company Coordinates


