
Compare Orient Tradelink with Similar Stocks
Stock DNA
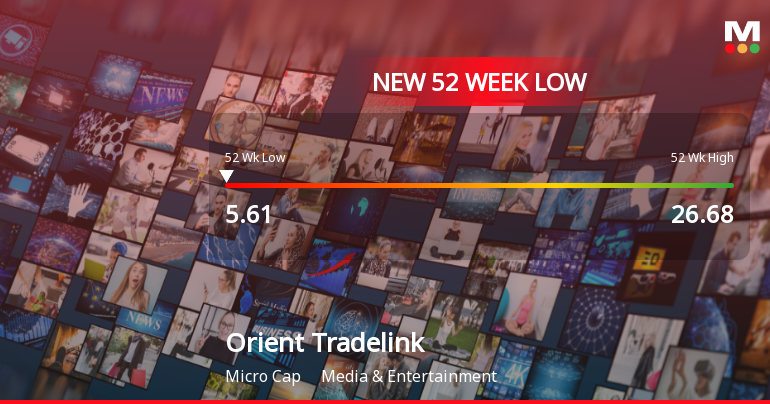
Media & Entertainment
INR 22 Cr (Micro Cap)
16.00
NA
0.00%
0.21
5.49%
0.90
Total Returns (Price + Dividend) 
Orient Tradelink for the last several years.
Risk Adjusted Returns v/s
Returns Beta

News

Orient Tradelink Ltd Valuation Shifts Signal Renewed Price Attractiveness
Orient Tradelink Ltd, a micro-cap player in the Media & Entertainment sector, has seen a notable shift in its valuation parameters, moving from a very expensive to an attractive valuation band. Despite persistent headwinds reflected in its stock performance and financial metrics, the recent adjustment in price-to-earnings (P/E) and price-to-book value (P/BV) ratios signals a potential reappraisal of the company’s price attractiveness relative to its historical and peer averages.
Read full news article
Announcements
Announcement under Regulation 30 (LODR)-Newspaper Publication
08-Jun-2026 | Source : BSEPursuant to Regulation 30 and 47(3) read with Schedule III of SEBI (Listing Obligations and Disclosure Requirements) Regulations 2015 please find herewith attached copies of Newspaper advertisement for the statement of Standalone Audited Financial Results for the Quarter and Year ended on 31st March 2026 published on 07th June 2026 and 08th June 2026 in following newspapers: 1. Financial Express (English) having nationwide circulation. 2. Financial Express in Gujarati (Regional) language.
Outcome Of The Board Meeting Pursuant To Regulation 30 Of SEBI (Listing Obligations & Disclosures Requirements) Regulations 2015
05-Jun-2026 | Source : BSEThis is to inform you that the Board of Directors of Orient Tradelink Limited (the Company) at their meeting held on Friday 05 June 2026 at the Corporate Office of the Company situated at 141-A Ground Floor Shahpur Jat Village New Delhi Delhi - 110049 has inter-alia considered and approved the matter as attached
Board Meeting Outcome for Outcome Of The Board Meeting Pursuant To Regulation 30 Of SEBI (Listing Obligations & Disclosures Requirements) Regulations 2015
05-Jun-2026 | Source : BSEThis is to inform you that the Board of Directors of Orient Tradelink Limited (the Company) at their meeting held on Friday 05th June 2026 at the Corporate Office of the Company situated at 141-A Ground Floor Shahpur Jat Village New Delhi Delhi -110049 has inter-alia considered and approved the matter as attached.
Corporate Actions

No Upcoming Board Meetings

No Dividend history available

Orient Tradelink Ltd has announced 10:2 stock split, ex-date: 17 Feb 21

No Bonus history available

Orient Tradelink Ltd has announced 1:1 rights issue, ex-date: 03 May 24
Quality key factors
Valuation key factors
Technicals key factors
 Technical Indicator Scale: Bearish, Mildly Bearish, Sideways, Mildly Bullish, Bullish Turned
 Shareholding Snapshot : Mar 2026
Shareholding Compare (%holding)
Non Institution
None
Held by 0 Schemes
Held by 0 FIIs
Aarti Khetarpal (0.24%)
Namita Shilpi Sinha (3.62%)
71.59%
Quarterly Results Snapshot (Standalone) - Mar'26 - YoY

YoY Growth in quarter ended Mar 2026 is -15.26% vs -13.07% in Mar 2025

YoY Growth in quarter ended Mar 2026 is 107.21% vs -63.24% in Mar 2025
Half Yearly Results Snapshot (Standalone) - Sep'25
Growth in half year ended Sep 2025 is 22.27% vs 129.35% in Sep 2024
Growth in half year ended Sep 2025 is -22.02% vs 289.29% in Sep 2024
Nine Monthly Results Snapshot (Standalone) - Dec'25
YoY Growth in nine months ended Dec 2025 is 8.34% vs 151.12% in Dec 2024
YoY Growth in nine months ended Dec 2025 is -19.87% vs 239.13% in Dec 2024
Annual Results Snapshot (Standalone) - Mar'26
YoY Growth in year ended Mar 2026 is 1.25% vs 59.32% in Mar 2025
YoY Growth in year ended Mar 2026 is 52.81% vs 394.44% in Mar 2025
About Orient Tradelink Ltd

Company Coordinates


