Orosil Smiths

  • Market Cap: Micro Cap
  • Industry: Gems, Jewellery And Watches
  • ISIN: INE628B01034
  • NSEID:
  • BSEID: 531626
INR
6.29
0.05 (0.8%)
BSENSE

Jul 10, 02:02 PM

BSE+NSE Vol: 36.53 k

  • Price Points
  • Score
  • Mojo Parameters
  • Total Return
  • News and Corporate Actions
  • Key factors
  • Shareholding
  • Financials
  • CompanyCV
stock-summaryPrice Point
High/Low

1Day

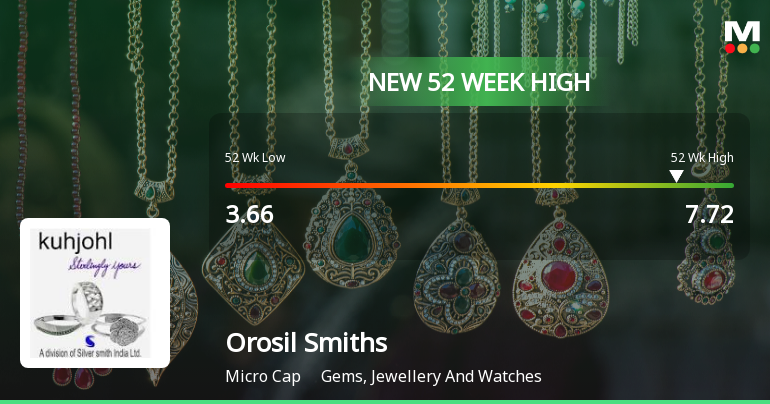
52 Week

Valuation
Technical
Day's Volume

CASH

36.53 k (-20.12%) Volume

Shareholding (Mar 2026)

FII

0.00%

Held by 0 FIIs

DII

0.00%

Held by 0 DIIs

Promoter

60.01%

Why is Orosil Smiths India Ltd falling/rising?

10-Jul-2026

As of 09-Jul, Orosil Smiths India Ltd's stock price is declining at 6.24, down 0.95%, and has underperformed its sector. Despite a strong year-to-date gain of 40.22%, recent trends indicate short-term weakness and mixed signals from moving averages.

As of 09-Jul, Orosil Smiths India Ltd's stock price is falling, currently at 6.24, reflecting a decrease of 0.06 or 0.95%. The stock has been underperforming, having lost 3.43% over the last two days, and it has also underperformed its sector by 1.01% today. <BR><BR>In terms of recent performance, the stock has shown a decline of 0.64% over the past week, while the benchmark Sensex has decreased by 0.98%. Although the stock has performed well year-to-date with a gain of 40.22%, it is currently facing downward pressure. The moving averages indicate that the stock is higher than the 50-day, 100-day, and 200-day moving averages, but lower than the 5-day and 20-day moving averages, suggesting a short-term weakness.<BR><BR>Despite the recent price drop, there is a notable increase in investor participation, with delivery volume rising by 33.78% compared to the 5-day average. However, this increase in participation has not yet translated into positive price movement. Overall, the combination of recent consecutive falls, underperformance relative to the sector, and mixed moving average signals contribute to the current decline in the stock price of Orosil Smiths India Ltd.

View full answer

How big is Orosil Smiths?

11-Jun-2026

As of 10th June, Orosil Smiths India Ltd has a market capitalization of 27.00 Cr, with recent Net Sales of 2.65 Cr and a Net Profit of 22.92 Cr. The company reported Shareholder's Funds of 2.23 Cr and Total Assets of 2.31 Cr for the annual period ending in March 2025.

As of 10th June, Orosil Smiths India Ltd has a market capitalization of 27.00 Cr, categorizing it as a Micro Cap company.<BR><BR>In the latest four quarters, Orosil Smiths reported Net Sales of 2.65 Cr and a Net Profit of 22.92 Cr.<BR><BR>For the latest annual period ending in March 2025, the company had Shareholder's Funds of 2.23 Cr and Total Assets of 2.31 Cr.

View full answer

Who are in the management team of Orosil Smiths?

11-Jun-2026

The management team of Orosil Smiths includes B K Narula (Chairman & Managing Director), Rita Narula (Whole-time Director), Bhavana S Kumar (Non-Executive & Independent Director), Karan Suri (Non-Executive & Non-Independent Director), and Vineet Aggarwal (Non-Executive & Independent Director).

The management team of Orosil Smiths includes the following members:<BR><BR>1. **B K Narula** - Chairman & Managing Director<BR>2. **Rita Narula** - Whole-time Director<BR>3. **Bhavana S Kumar** - Non-Executive & Independent Director<BR>4. **Karan Suri** - Non-Executive & Non-Independent Director<BR>5. **Vineet Aggarwal** - Non-Executive & Independent Director<BR><BR>If you need more details about their roles or the company's operations, feel free to ask!

View full answer

Who are the peers of the Orosil Smiths?

11-Jun-2026

Orosil Smiths' peers include Shoora Designs, Kanani Industrie, Deep Health AI, Kenvi Jewels, Goenka Diamond, S K Internation, Darshan Orna, Koura Fine Diamo, and York Exports. Orosil Smiths has an average management risk and a 1-year return of 40.81%, while S K Internation leads with a 91.19% return.

Peers: The peers of Orosil Smiths are Shoora Designs, Kanani Industrie, Deep Health AI, Kenvi Jewels, Goenka Diamond, S K Internation., Darshan Orna, Koura Fine Diamo, and York Exports.<BR><BR>Quality Snapshot: Below Average management risk is observed at Shoora Designs, Kanani Industrie, Deep Health AI, Kenvi Jewels, Goenka Diamond, S K Internation., Darshan Orna, Koura Fine Diamo, York Exports, and Shubhlaxmi Jewel, while Average management risk is found at Orosil Smiths. Growth is rated as Good for Deep Health AI and Koura Fine Diamo, Average for Kenvi Jewels, and Below Average for the rest. Capital Structure is rated as Good for Shoora Designs and Koura Fine Diamo, Average for Darshan Orna, and Below Average for all other peers including Orosil Smiths.<BR><BR>Return Snapshot: The peer with the highest 1-year return is S K Internation. at 91.19%, while Deep Health AI has the lowest at -54.16%. Orosil Smiths has a 1-year return of 40.81%, which is significantly higher than Deep Health AI but lower than S K Internation. Additionally, peers with negative six-month returns include Deep Health AI, Kanani Industrie, Kenvi Jewels, Goenka Diamond, and Koura Fine Diamo.

View full answer

What does Orosil Smiths do?

10-Jun-2026

Orosil Smiths India Ltd manufactures and trades in gold and silver ornaments and utensils, operating in the Gems, Jewellery, and Watches industry as a Micro Cap company. As of March 2026, it reported net sales of 1 Cr and a net profit of 23 Cr, with a market cap of INR 27 Cr.

Overview: <BR>Orosil Smiths India Ltd is engaged in the manufacturing, fabrication, sale, purchase, and trading of all kinds of Gold, Silver, and Silver Ornaments/Utensils, operating within the Gems, Jewellery And Watches industry and categorized as a Micro Cap company.<BR><BR>History: <BR>The company was initially incorporated as Silver Smith India Limited on June 1, 1994, and was renamed to Orosil Smiths India Limited in 2013. The latest quarterly results reported net sales and net profit for the period ending March 2026.<BR><BR>Financial Snapshot: <BR>Most recent Net Sales: 1 Cr (Quarterly Results - Mar 2026) <BR>Most recent Net Profit: 23 Cr (Quarterly Results - Mar 2026) <BR>Market-cap value: INR 27 Cr (Micro Cap)<BR><BR>Key Metrics: <BR>P/E: 1.00 <BR>Industry P/E: 45 <BR>Dividend Yield: 0.00% <BR>Debt-Equity: -0.17 <BR>Return on Equity: 90.52% <BR>Price to Book: 1.03 <BR><BR>Contact Details: <BR>Address: Hemkunt Chambers Flat No 620, 89 Nehru Place New Delhi New Delhi : 110019 <BR>Tel: 91-0120-2540571-72-73 <BR>Email: info@orosil.com <BR>Website: http://www.orosil.com ; www.silversmithindia.com

View full answer

Should I buy, sell or hold Orosil Smiths India Ltd?

24-May-2026

Are Orosil Smiths India Ltd latest results good or bad?

07-Feb-2026

Orosil Smiths India Ltd's latest Q2 FY26 results show a strong turnaround with a net profit of ₹0.24 crores and a 1316.67% revenue increase year-on-year. However, concerns about sustainability due to past volatility and a small market cap suggest potential investors should proceed with caution.

Orosil Smiths India Ltd's latest results for Q2 FY26 show a significant turnaround, with a net profit of ₹0.24 crores, marking a 700% increase quarter-on-quarter and a return to profitability year-on-year. Revenue also surged to ₹0.85 crores, reflecting an impressive 1316.67% growth compared to the same quarter last year. The PAT margin improved to 28.24%, a substantial recovery from the previous year's negative margin.<BR><BR>However, while these figures appear strong on the surface, there are underlying concerns. The revenue saw a slight decline of 3.41% compared to the previous quarter, and the company has a history of volatility in its financial performance. The recent profit was heavily influenced by other income, which raises questions about the sustainability of these earnings. <BR><BR>Additionally, the company's market capitalization is quite small at ₹18 crores, limiting its growth potential and attractiveness to institutional investors. The stock has also underperformed relative to its sector over the past year, despite a recent mildly bullish trend.<BR><BR>In summary, while the latest results indicate a positive shift for Orosil Smiths, the sustainability of this performance remains uncertain, and potential investors should be cautious given the company's historical volatility and current market position.

View full answer

When is the next results date for Orosil Smiths India Ltd?

28-Jan-2026

The next results date for Orosil Smiths India Ltd is 06 February 2026.

The next results date for Orosil Smiths India Ltd is scheduled for 06 February 2026.

View full answer

How has been the historical performance of Orosil Smiths?

19-Nov-2025

Orosil Smiths has shown fluctuating historical performance, with net sales rising to 2.81 Cr in March 2025 from 0.50 Cr in March 2024, and profit after tax turning positive at 0.61 Cr. Despite increased total expenditure, the company improved its operating profit and earnings per share, indicating a positive financial shift.

Answer:<BR>The historical performance of Orosil Smiths shows a fluctuating trend in net sales and profitability over the years, with a notable improvement in the most recent fiscal year.<BR><BR>Breakdown:<BR>Orosil Smiths reported net sales of 2.81 Cr in March 2025, a significant increase from 0.50 Cr in March 2024 and 0.74 Cr in March 2023. Total operating income followed a similar trend, rising to 2.81 Cr in March 2025 from 0.50 Cr in March 2024. However, the total expenditure also increased to 2.92 Cr in March 2025, up from 0.79 Cr in March 2024, leading to an operating profit (PBDIT) of -0.09 Cr in March 2025, which is an improvement from -0.25 Cr in March 2024. The profit before tax also improved to -0.24 Cr in March 2025 from -0.41 Cr in March 2024. Notably, the profit after tax turned positive at 0.61 Cr in March 2025, contrasting with losses in the previous years. The company's total assets decreased to 2.31 Cr in March 2025 from 2.43 Cr in March 2024, while total liabilities also decreased to 2.31 Cr in March 2025 from 2.43 Cr in March 2024. The earnings per share (EPS) improved to 0.15 in March 2025, compared to -0.10 in March 2024, indicating a positive shift in financial performance.

View full answer

Is Orosil Smiths overvalued or undervalued?

09-Jun-2025

As of July 26, 2023, Orosil Smiths is rated as "risky" and overvalued, with a PE ratio of 22.81, a Price to Book Value of 10.23, and a negative EV to EBIT ratio of -22.79, despite outperforming the Sensex with a 21.58% return over the past year.

As of 26 July 2023, Orosil Smiths has moved from a valuation grade of "does not qualify" to "risky." The company is currently considered overvalued. Key ratios include a PE ratio of 22.81, a Price to Book Value of 10.23, and a PEG ratio of 0.10, which indicates a significant discrepancy between its price and growth potential.<BR><BR>In comparison to its peers, Orosil Smiths' PE ratio is notably lower than that of Titan Company, which stands at 94.61, and Kalyan Jewellers, which is at 81.3, both of which are categorized differently in terms of valuation. Additionally, Orosil Smiths has a negative EV to EBIT and EV to EBITDA ratio of -22.79, suggesting operational challenges. While the company's stock has outperformed the Sensex over the past year with a return of 21.58% compared to the Sensex's 7.64%, the overall valuation metrics indicate that it remains overvalued in the current market context.

View full answer

What is the technical trend for Orosil Smiths?

09-Jun-2025

As of April 29, 2025, Orosil Smiths shows a bullish technical trend, supported by daily moving averages and a bullish weekly MACD, despite mixed signals from Dow Theory.

As of 29 April 2025, the technical trend for Orosil Smiths has changed from mildly bullish to bullish. The daily moving averages are bullish, supporting the positive trend. The weekly MACD is also bullish, while the monthly MACD is mildly bullish, indicating a strengthening momentum. The Bollinger Bands reflect a mildly bullish stance on both weekly and monthly time frames. However, the Dow Theory presents a mixed view with a mildly bearish weekly signal and a mildly bullish monthly signal. Overall, the current technical stance is bullish with moderate strength, driven primarily by the daily moving averages and the weekly MACD.

View full answer

Who are the top shareholders of the Orosil Smiths?

06-Jun-2025

The top shareholders of Orosil Smiths are B.K. Narula with 17.26%, Nam Securities Ltd at 11.96%, and individual investors collectively holding 22.87%. There are no mutual funds or foreign institutional investors involved.

The top shareholders of Orosil Smiths include B.K. Narula, who holds the largest stake at 17.26%. The highest public shareholder is Nam Securities Ltd, with a holding of 11.96%. Additionally, individual investors collectively hold 22.87% of the company's shares. There are no mutual funds or foreign institutional investors currently holding shares in the company.

View full answer

Has Orosil Smiths declared dividend?

06-Jun-2025

No Dividend History Available

iScoreScore
Click here to find our call on this stock
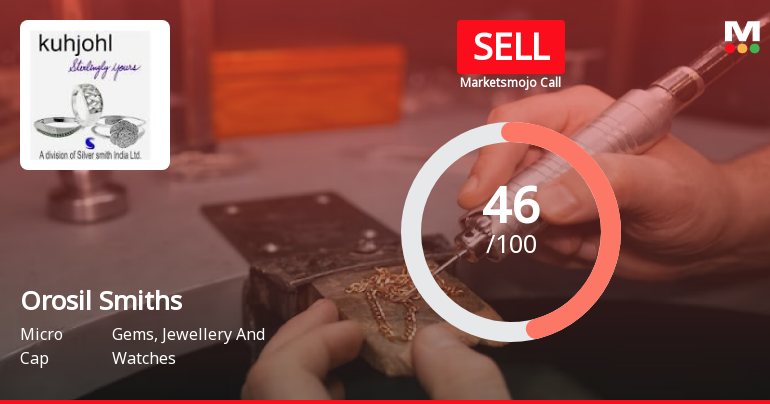
Strong Sell
Sell
Hold
Buy
Strong Buy

Dashboard

1

Weak Long Term Fundamental Strength with a 2.29% CAGR growth in Operating Profits over the last 5 years

  • Low ability to service debt as the company has a high Debt to EBITDA ratio of -0.21 times
2

Risky - Negative EBITDA

stock-summaryMojo Parameters

Mojo Parameters

Loading Valuation Snapshot...

Stock DNA

stock-summary
Industry

Gems, Jewellery And Watches

stock-summary
Market cap

INR 26 Cr (Micro Cap)

stock-summary
P/E

1.00

stock-summary
Industry P/E

51

stock-summary
Dividend Yield

0.00%

stock-summary
Debt Equity

-0.17

stock-summary
Return on Equity

90.52%

stock-summary
Price to Book

1.01

Revenue and Profits:
Net Sales:
1 Cr
(Quarterly Results - Mar 2026)
Net Profit:
23 Cr
stock-summaryTotal Returns
Total Returns (Price + Dividend) stock-summary
Dividend Yield (0%)
TimePeriod
Price Return
Dividend Return
Total Return
3 Months
2.95%
0%
2.95%
6 Months
38.24%
0%
38.24%
1 Year
42.31%
0%
42.31%
2 Years
59.24%
0%
59.24%
3 Years
0%
0%
0.0%
4 Years
16.27%
0%
16.27%
5 Years
85.0%
0%
85.0%

Orosil Smiths for the last several years.

Risk Adjusted Returns v/s stock-summary
Returns Beta
Icon
Beta has not been calculated since enough price history is not available
stock-summaryNews & Corporate Actions

Announcements stock-summary

Closure of Trading Window

22-Jun-2026 | Source : BSE

Please find attached

Disclosures under Reg. 29(2) of SEBI (SAST) Regulations 2011

19-Jun-2026 | Source : BSE

The Exchange has received the disclosure under Regulation 29(2) of SEBI (Substantial Acquisition of Shares & Takeovers) Regulations 2011 for B K Narula HUF

Disclosures under Reg. 29(2) of SEBI (SAST) Regulations 2011

19-Jun-2026 | Source : BSE

The Exchange has received the disclosure under Regulation 29(2) of SEBI (Substantial Acquisition of Shares & Takeovers) Regulations 2011 for B K Narula HUF

Corporate Actions stock-summary

stock-summary
BOARD MEETING

No Upcoming Board Meetings

stock-summary
DIVIDEND

No Dividend history available

stock-summary
SPLITS

Orosil Smiths India Ltd has announced 1:5 stock split, ex-date: 24 Aug 17

stock-summary
BONUS

No Bonus history available

stock-summary
RIGHTS

No Rights history available

stock-summaryKey Factors

Quality key factors stock-summary

Factor
Value
Sales Growth (5y)
25.87%
EBIT Growth (5y)
2.29%
EBIT to Interest (avg)
-0.32
Debt to EBITDA (avg)
Negative Net Debt
Net Debt to Equity (avg)
-0.17
Sales to Capital Employed (avg)
0.57
Tax Ratio
14.76%
Dividend Payout Ratio
0
Pledged Shares
0
Institutional Holding
0
ROCE (avg)
-14.67%
ROE (avg)
23.49%

Valuation key factors

Factor
Value
P/E Ratio
1
Industry P/E
51
Price to Book Value
1.01
EV to EBIT
-21.36
EV to EBITDA
-21.36
EV to Capital Employed
1.01
EV to Sales
8.06
PEG Ratio
NA
Dividend Yield
NA
ROCE (Latest)
-1.14%
ROE (Latest)
90.52%

Technicals key factors

Indicator
Weekly
Monthly
MACD
Bullish
Bullish
RSI
Bearish
No Signal
Bollinger Bands
Mildly Bullish
Mildly Bullish
Moving Averages
Bullish (Daily)
KST
Bullish
Bullish
Dow Theory
Mildly Bearish
No Trend
stock-summary Technical Indicator Scale: Bearish, Mildly Bearish, Sideways, Mildly Bullish, Bullish  Turned 
stock-summaryShareholding
Shareholding Snapshot : Mar 2026stock-summary
Shareholding Compare (%holding) stock-summary
Majority shareholders

Promoters

Pledged Promoter Holdings

None

Mutual Funds

Held by 0 Schemes

FIIs

Held by 0 FIIs

Promoter with highest holding

B.k.narula (17.26%)

Highest Public shareholder

Nam Securities Limited (4.84%)

Individual Investors Holdings

22.4%

stock-summaryFinancial
[
  {
    "link": "quarterly",
    "btn_text": "All Quarterly Results",
    "header": "Quarterly Results Snapshot (Standalone) - Mar'26 - QoQ",
    "rhs": [
      {
        "prefix": "Net Sales ",
        "suffix": "QoQ Growth in quarter ended Mar 2026 is 24.39% vs -51.76% in Dec 2025",
        "dir": 1
      },
      {
        "prefix": "Standalone Net Profit ",
        "suffix": "QoQ Growth in quarter ended Mar 2026 is 32,557.14% vs -129.17% in Dec 2025",
        "dir": 1
      }
    ],
    "table": {
      "header": [
        "Mar'26",
        "Dec'25",
        "Change(%)"
      ],
      "body": [
        {
          "field": "Net Sales",
          "val1": "0.51",
          "val2": "0.41",
          "chgp": "24.39%",
          "chgp_class": "positive"
        },
        {
          "field": "Operating Profit (PBDIT) excl Other Income",
          "val1": "0.03",
          "val2": "-0.11",
          "chgp": "127.27%",
          "chgp_class": "positive"
        },
        {
          "field": "Interest",
          "val1": "0.00",
          "val2": "0.00",
          "chgp": "",
          "chgp_class": "neutral"
        },
        {
          "field": "Exceptional Items",
          "val1": "0.00",
          "val2": "0.00",
          "chgp": "",
          "chgp_class": "neutral"
        },
        {
          "field": "Standalone Net Profit",
          "val1": "22.72",
          "val2": "-0.07",
          "chgp": "32,557.14%",
          "chgp_class": "positive"
        },
        {
          "field": "Operating Profit Margin (Excl OI)",
          "val1": "5.88%",
          "val2": "-26.83%",
          "chgp": "32.71%",
          "chgp_class": "positive"
        }
      ]
    }
  },
  {
    "link": "half-yearly",
    "btn_text": "All Half Yearly Results",
    "header": "Half Yearly Results Snapshot (Standalone) - Sep'25",
    "rhs": [
      {
        "prefix": "Net Sales ",
        "suffix": " Growth in half year ended Sep 2025 is 1,630.00% vs -44.44% in Sep 2024",
        "dir": 1
      },
      {
        "prefix": "Standalone Net Profit ",
        "suffix": " Growth in half year ended Sep 2025 is 212.50% vs 7.69% in Sep 2024",
        "dir": 1
      }
    ],
    "table": {
      "header": [
        "Sep'25",
        "Sep'24",
        "Change(%)"
      ],
      "body": [
        {
          "field": "Net Sales",
          "val1": "1.73",
          "val2": "0.10",
          "chgp": "1,630.00%",
          "chgp_class": "positive"
        },
        {
          "field": "Operating Profit (PBDIT) excl Other Income",
          "val1": "-0.03",
          "val2": "-0.17",
          "chgp": "82.35%",
          "chgp_class": "positive"
        },
        {
          "field": "Interest",
          "val1": "0.00",
          "val2": "0.01",
          "chgp": "-100.00%",
          "chgp_class": "positive"
        },
        {
          "field": "Exceptional Items",
          "val1": "0.00",
          "val2": "0.00",
          "chgp": "",
          "chgp_class": "neutral"
        },
        {
          "field": "Standalone Net Profit",
          "val1": "0.27",
          "val2": "-0.24",
          "chgp": "212.50%",
          "chgp_class": "positive"
        },
        {
          "field": "Operating Profit Margin (Excl OI)",
          "val1": "-1.73%",
          "val2": "-170.00%",
          "chgp": "168.27%",
          "chgp_class": "positive"
        }
      ]
    }
  },
  {
    "link": "nine-monthly",
    "btn_text": "All Nine Monthly Results",
    "header": "Nine Monthly Results Snapshot (Standalone) - Dec'25",
    "rhs": [
      {
        "prefix": "Net Sales ",
        "suffix": "YoY Growth in nine months ended Dec 2025 is 494.44% vs -5.26% in Dec 2024",
        "dir": 1
      },
      {
        "prefix": "Standalone Net Profit ",
        "suffix": "YoY Growth in nine months ended Dec 2025 is 195.24% vs 36.36% in Dec 2024",
        "dir": 1
      }
    ],
    "table": {
      "header": [
        "Dec'25",
        "Dec'24",
        "Change(%)"
      ],
      "body": [
        {
          "field": "Net Sales",
          "val1": "2.14",
          "val2": "0.36",
          "chgp": "494.44%",
          "chgp_class": "positive"
        },
        {
          "field": "Operating Profit (PBDIT) excl Other Income",
          "val1": "-0.14",
          "val2": "-0.12",
          "chgp": "-16.67%",
          "chgp_class": "negative"
        },
        {
          "field": "Interest",
          "val1": "0.00",
          "val2": "0.01",
          "chgp": "-100.00%",
          "chgp_class": "positive"
        },
        {
          "field": "Exceptional Items",
          "val1": "0.00",
          "val2": "0.00",
          "chgp": "",
          "chgp_class": "neutral"
        },
        {
          "field": "Standalone Net Profit",
          "val1": "0.20",
          "val2": "-0.21",
          "chgp": "195.24%",
          "chgp_class": "positive"
        },
        {
          "field": "Operating Profit Margin (Excl OI)",
          "val1": "-6.54%",
          "val2": "-33.33%",
          "chgp": "26.79%",
          "chgp_class": "positive"
        }
      ]
    }
  },
  {
    "link": "annual",
    "btn_text": "All Annual Results",
    "header": "Annual Results Snapshot (Standalone) - Mar'26",
    "rhs": [
      {
        "prefix": "Net Sales ",
        "suffix": "YoY Growth in year ended Mar 2026 is -5.69% vs 462.00% in Mar 2025",
        "dir": -1
      },
      {
        "prefix": "Standalone Net Profit ",
        "suffix": "YoY Growth in year ended Mar 2026 is 3,657.38% vs 248.78% in Mar 2025",
        "dir": 1
      }
    ],
    "table": {
      "header": [
        "Mar'26",
        "Mar'25",
        "Change(%)"
      ],
      "body": [
        {
          "field": "Net Sales",
          "val1": "2.65",
          "val2": "2.81",
          "chgp": "-5.69%",
          "chgp_class": "negative"
        },
        {
          "field": "Operating Profit (PBDIT) excl Other Income",
          "val1": "-0.11",
          "val2": "-0.11",
          "chgp": "",
          "chgp_class": "neutral"
        },
        {
          "field": "Interest",
          "val1": "0.01",
          "val2": "0.01",
          "chgp": "",
          "chgp_class": "neutral"
        },
        {
          "field": "Exceptional Items",
          "val1": "0.00",
          "val2": "0.00",
          "chgp": "",
          "chgp_class": "neutral"
        },
        {
          "field": "Standalone Net Profit",
          "val1": "22.92",
          "val2": "0.61",
          "chgp": "3,657.38%",
          "chgp_class": "positive"
        },
        {
          "field": "Operating Profit Margin (Excl OI)",
          "val1": "-4.15%",
          "val2": "-3.91%",
          "chgp": "-0.24%",
          "chgp_class": "negative"
        }
      ]
    }
  }
]

Quarterly Results Snapshot (Standalone) - Mar'26 - QoQstock-summary

Mar'26
Dec'25
Change(%)
Net Sales
0.51
0.41
24.39%
Operating Profit (PBDIT) excl Other Income
0.03
-0.11
127.27%
Interest
0.00
0.00
Exceptional Items
0.00
0.00
Standalone Net Profit
22.72
-0.07
32,557.14%
Operating Profit Margin (Excl OI)
5.88%
-26.83%
32.71%
Values in Rs Cr.
Direction Arrows
Net Sales

QoQ Growth in quarter ended Mar 2026 is 24.39% vs -51.76% in Dec 2025

Direction Arrows
Standalone Net Profit

QoQ Growth in quarter ended Mar 2026 is 32,557.14% vs -129.17% in Dec 2025

Half Yearly Results Snapshot (Standalone) - Sep'25stock-summary

Sep'25
Sep'24
Change(%)
Net Sales
1.73
0.10
1,630.00%
Operating Profit (PBDIT) excl Other Income
-0.03
-0.17
82.35%
Interest
0.00
0.01
-100.00%
Exceptional Items
0.00
0.00
Standalone Net Profit
0.27
-0.24
212.50%
Operating Profit Margin (Excl OI)
-1.73%
-170.00%
168.27%
Values in Rs Cr.
Direction Arrows
Net Sales

Growth in half year ended Sep 2025 is 1,630.00% vs -44.44% in Sep 2024

Direction Arrows
Standalone Net Profit

Growth in half year ended Sep 2025 is 212.50% vs 7.69% in Sep 2024

Nine Monthly Results Snapshot (Standalone) - Dec'25stock-summary

Dec'25
Dec'24
Change(%)
Net Sales
2.14
0.36
494.44%
Operating Profit (PBDIT) excl Other Income
-0.14
-0.12
-16.67%
Interest
0.00
0.01
-100.00%
Exceptional Items
0.00
0.00
Standalone Net Profit
0.20
-0.21
195.24%
Operating Profit Margin (Excl OI)
-6.54%
-33.33%
26.79%
Values in Rs Cr.
Direction Arrows
Net Sales

YoY Growth in nine months ended Dec 2025 is 494.44% vs -5.26% in Dec 2024

Direction Arrows
Standalone Net Profit

YoY Growth in nine months ended Dec 2025 is 195.24% vs 36.36% in Dec 2024

Annual Results Snapshot (Standalone) - Mar'26stock-summary

Mar'26
Mar'25
Change(%)
Net Sales
2.65
2.81
-5.69%
Operating Profit (PBDIT) excl Other Income
-0.11
-0.11
Interest
0.01
0.01
Exceptional Items
0.00
0.00
Standalone Net Profit
22.92
0.61
3,657.38%
Operating Profit Margin (Excl OI)
-4.15%
-3.91%
-0.24%
Values in Rs Cr.
Direction Arrows
Net Sales

YoY Growth in year ended Mar 2026 is -5.69% vs 462.00% in Mar 2025

Direction Arrows
Standalone Net Profit

YoY Growth in year ended Mar 2026 is 3,657.38% vs 248.78% in Mar 2025

stock-summaryCompany CV
About Orosil Smiths India Ltd stock-summary
stock-summary
Orosil Smiths India Ltd
Micro Cap
Gems, Jewellery And Watches
Orosil Smiths India Limited was initially incorporated as Silver Smith India Limited on June 1, 1994. The Company renamed to Orosil Smiths India Limited in 2013. The Company engages in the manufacturing, fabrication, sale, purchase, trading/dealing in all kinds of Gold, Silver, Silver Ornaments/Utensils and all other items of Gold, Silver and allied business.
Company Coordinates stock-summary
Company Details
Hemkunt Chambers Flat No 620, 89 Nehru Place New Delhi New Delhi : 110019
stock-summary
Tel: 91-0120-2540571-72-73
stock-summary
info@orosil.com
Registrar Details
Skyline Financial Services Pvt Ltd , D-153/A, 1st Floor, Okhla Industrial Area, Phase - I, New Delhi