
Compare Ortel Commu. with Similar Stocks
Dashboard
Weak Long Term Fundamental Strength as the company has not declared results in the last 6 months
- Poor long term growth as Net Sales has grown by an annual rate of -21.19% and Operating profit at 0% over the last 5 years
- The company has a negative book value of Rs 77.18 crore
With a fall in Operating Profit of -1497.85%, the company declared Very Negative results in Jun 21
Risky - No result in last 6 months
Underperformed the market in the last 1 year
Stock DNA
Media & Entertainment
INR 6 Cr (Micro Cap)
NA (Loss Making)
16
0.00%
-2.22
28.44%
-0.07
Total Returns (Price + Dividend) 
Ortel Commu. for the last several years.
Risk Adjusted Returns v/s
Returns Beta

News

Ortel Communications Ltd Locks at Upper Circuit With 4.79% Gain — Buyers Queue, Sellers Absent
At Rs 1.75, the buying was done — not because demand dried up, but because the exchange wouldn't let the stock go any higher. Ortel Communications Ltd locked at its upper circuit of 4.79% on 10 Jun 2026, with buyers queuing and no sellers willing to part with shares.
Read full news article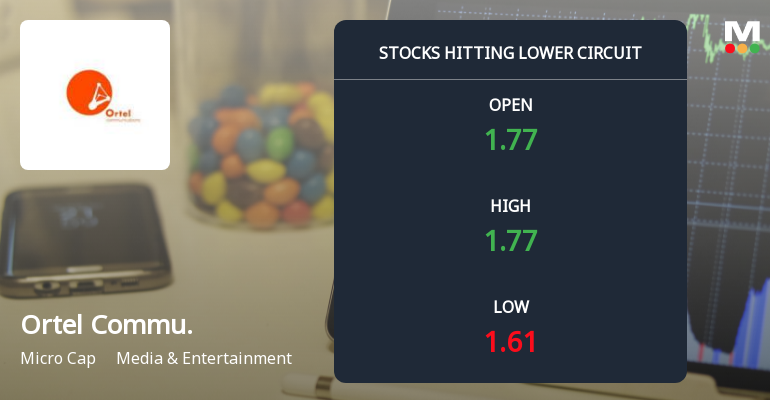
Ortel Communications Ltd Locks at Lower Circuit With 5% Loss — Sellers Queue, No Buyers in Sight
At Rs 1.60, sellers were still queuing — but there were no buyers willing to take the other side. Ortel Communications Ltd locked at its lower circuit of 5% on 8 Jun 2026, with unfilled sell orders and a frozen price, signalling a pronounced imbalance in supply and demand.
Read full news article
Ortel Communications Ltd Locks at Upper Circuit With 5.0% Gain — Buyers Queue, Sellers Absent
At Rs 1.68, the buying was done — not because demand dried up, but because the exchange wouldn't let the stock go any higher. Ortel Communications Ltd locked at its upper circuit of 5.0% on 04 Jun 2026, with buyers queuing and no sellers willing to part with shares.
Read full news article Announcements
Ortel Communications to conduct board meeting
06-Feb-2021 | Source : BSEOrtel Communications will hold a meeting of the Board of Directors of the Company on 12 February 2021.
Ortel Communications to conduct board meeting
09-Nov-2020 | Source : BSEOrtel Communications will hold a meeting of the Board of Directors of the Company on 13 November 2020.
Ortel Communications to table results
11-Sep-2020 | Source : BSEOrtel Communications will hold a meeting of the Board of Directors of the Company on 15 September 2020.
Corporate Actions

No Upcoming Board Meetings

No Dividend history available

No Splits history available

No Bonus history available

No Rights history available
Quality key factors
Valuation key factors
Technicals key factors
 Technical Indicator Scale: Bearish, Mildly Bearish, Sideways, Mildly Bullish, Bullish Turned
 Shareholding Snapshot : Jun 2020
Shareholding Compare (%holding)
Promoters
13.6758
Held by 0 Schemes
Held by 6 FIIs (9.24%)
Metro Skynet Ltd (14.74%)
Elizabeth Mathew . (4.36%)
28.63%
Quarterly Results Snapshot (Consolidated) - Jun'21 - QoQ

QoQ Growth in quarter ended Jun 2021 is -28.68% vs -10.05% in Mar 2021

QoQ Growth in quarter ended Jun 2021 is -12.17% vs -30.91% in Mar 2021
Half Yearly Results Snapshot (Consolidated) - Sep'20
Growth in half year ended Sep 2020 is -16.41% vs -29.69% in Sep 2019
Growth in half year ended Sep 2020 is 62.47% vs 37.38% in Sep 2019
Nine Monthly Results Snapshot (Consolidated) - Dec'20
YoY Growth in nine months ended Dec 2020 is -18.81% vs -25.69% in Dec 2019
YoY Growth in nine months ended Dec 2020 is 48.20% vs 39.83% in Dec 2019
Annual Results Snapshot (Consolidated) - Mar'21
YoY Growth in year ended Mar 2021 is -21.24% vs -21.95% in Mar 2020
YoY Growth in year ended Mar 2021 is 37.01% vs 31.95% in Mar 2020
About Ortel Communications Ltd

Company Coordinates


