
Compare Pace Digitek with Similar Stocks
Dashboard
High Management Efficiency with a high ROE of 0%
The company is Net-Debt Free
Poor long term growth as Operating profit has grown by an annual rate 0% of over the last 5 years
Flat results in Mar 26
With ROE of 13.5, it has a Expensive valuation with a 2 Price to Book Value
Falling Participation by Institutional Investors
Stock DNA
Telecom - Equipment & Accessories
INR 4,383 Cr (Small Cap)
15.00
21
0.00%
0.10
13.48%
1.98
Total Returns (Price + Dividend) 
Pace Digitek for the last several years.
Risk Adjusted Returns v/s
Returns Beta

News
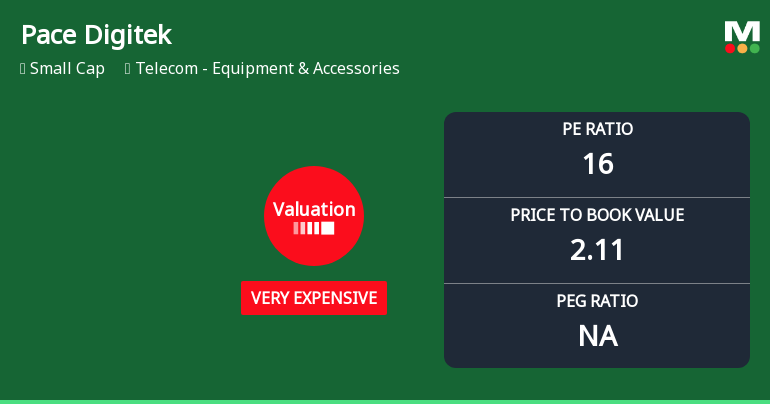
Pace Digitek Ltd Valuation Shifts to Very Expensive Amid Strong Price Performance
Pace Digitek Ltd, a small-cap player in the Telecom - Equipment & Accessories sector, has witnessed a notable shift in its valuation parameters, moving from an expensive to a very expensive rating. This change, coupled with a recent upgrade in its Mojo Grade from Sell to Hold, reflects evolving market perceptions and a reassessment of its price attractiveness relative to historical and peer benchmarks.
Read full news article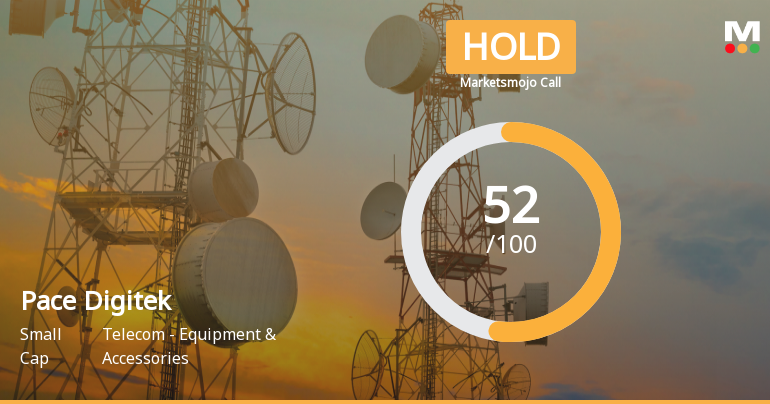
Pace Digitek Ltd is Rated Hold by MarketsMOJO
Pace Digitek Ltd is rated 'Hold' by MarketsMOJO, with this rating last updated on 22 June 2026. While the rating change occurred on that date, the analysis and financial metrics presented here reflect the stock's current position as of 10 July 2026, providing investors with the most up-to-date view of the company’s fundamentals, returns, and market standing.
Read full news article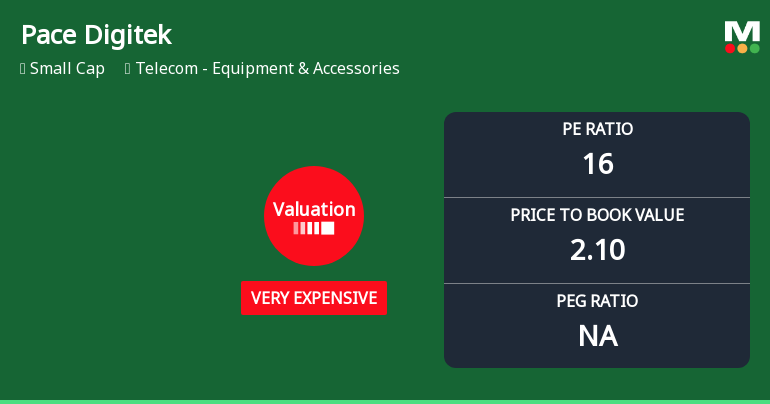
Pace Digitek Ltd Valuation Shifts Signal Changing Market Perception
Pace Digitek Ltd, a small-cap player in the Telecom - Equipment & Accessories sector, has seen a notable shift in its valuation parameters, moving from a fair to a very expensive rating. This change reflects evolving market perceptions amid strong stock performance relative to benchmarks, prompting a reassessment of its price attractiveness compared to peers and historical averages.
Read full news article Announcements
Announcement under Regulation 30 (LODR)-Press Release / Media Release
13-Jul-2026 | Source : BSEPress release for memorandum of Understanding with Bondada Renewable Energy Private Limited.
Announcement under Regulation 30 (LODR)-Memorandum of Understanding /Agreements
10-Jul-2026 | Source : BSEIntimation of Memorandum of Understanding.
Announcement under Regulation 30 (LODR)-Memorandum of Understanding /Agreements
09-Jul-2026 | Source : BSEM/s. Lineage Power Private Limited A material subsidiary of the company has entered into a memorandum of understanding for supply of Battery Energy Storage Systems
Corporate Actions

No Upcoming Board Meetings

No Dividend history available

No Splits history available

No Bonus history available

No Rights history available
Quality key factors
Valuation key factors
Technicals key factors
 Technical Indicator Scale: Bearish, Mildly Bearish, Sideways, Mildly Bullish, Bullish Turned
 Shareholding Snapshot : Mar 2026
Shareholding Compare (%holding)
Promoters
None
Held by 2 Schemes (4.12%)
Held by 10 FIIs (0.56%)
Maddisetty Venugopal Rao (23.18%)
Bandhan Small Cap Fund (3.6%)
15.46%
Quarterly Results Snapshot (Standalone) - Mar'26 - QoQ

QoQ Growth in quarter ended Mar 2026 is -10.14% vs 58.43% in Dec 2025
QoQ Growth in quarter ended Mar 2026 is -56.46% vs 51.64% in Dec 2025
Half Yearly Results Snapshot (Standalone) - Sep'25
Not Applicable: The company has declared_date for only one period
Not Applicable: The company has declared_date for only one period
Nine Monthly Results Snapshot (Standalone) - Dec'25
Not Applicable: The company has declared_date for only one period
Not Applicable: The company has declared_date for only one period
Annual Results Snapshot (Standalone) - Mar'26
Not Applicable: The company has declared_date for only one period
Not Applicable: The company has declared_date for only one period
About Pace Digitek Ltd

Company Coordinates


