
Compare Padam Cotton with Similar Stocks
Stock DNA
Garments & Apparels
INR 22 Cr (Micro Cap)
2.00
21
6.00%
0.00
24.45%
0.48
Total Returns (Price + Dividend) 
Latest dividend: 0.1 per share ex-dividend date: Sep-23-2025
Risk Adjusted Returns v/s
Returns Beta

News
Are Padam Cotton Yarns Ltd latest results good or bad?
Padam Cotton Yarns Ltd's latest financial results for Q4 FY26 indicate significant operational growth, with net profit reaching ₹4.33 crores, representing a year-on-year increase of 91.59%. Revenue also saw a substantial rise, totaling ₹24.41 crores, which marks an 86.19% increase compared to the same quarter last year. The operating profit margin improved to 22.82%, the highest in seven quarters, suggesting enhanced operational efficiency and cost management. Despite these positive operational metrics, the company operates under a governance structure characterized by zero promoter and institutional holdings, raising concerns about accountability and long-term sustainability. The absence of institutional interest may reflect broader market skepticism regarding the durability of the recent financial improvements. Additionally, while the company's quarterly results show strong growth, the full-year perform...
Read full news article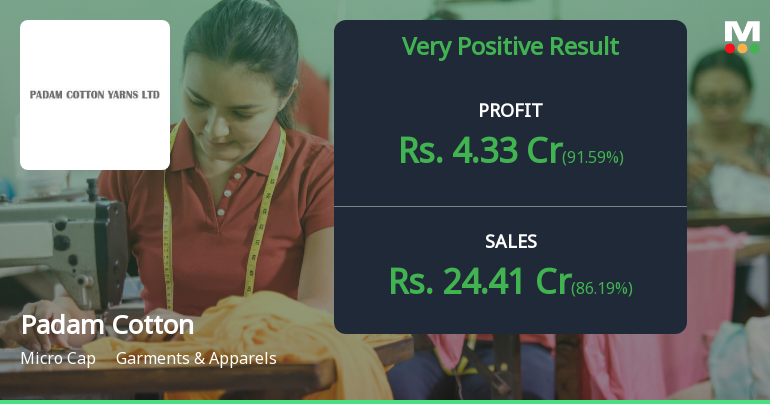
Padam Cotton Yarns Q4 FY26: Sharp Revenue Growth Masks Deep Structural Concerns
Padam Cotton Yarns Ltd., a micro-cap player in the garments and apparels sector, reported net profit of ₹4.33 crores in Q4 FY26, marking an 85.84% surge quarter-on-quarter and a 91.59% jump year-on-year. Despite these impressive headline numbers, the company's stock has collapsed 76.29% over the past year, currently trading at ₹0.99 with a market capitalisation of just ₹21.73 crores. The dramatic disconnect between operational performance and market confidence reveals deeper concerns about sustainability, corporate governance, and the quality of reported earnings.
Read full news article
Padam Cotton Yarns Ltd Reports Strong Quarterly Turnaround Amid Challenging Market
Padam Cotton Yarns Ltd has demonstrated a marked turnaround in its financial trajectory during the quarter ended March 2026, posting its highest-ever quarterly net sales and profitability metrics. Despite lingering challenges typical of micro-cap stocks in the Garments & Apparels sector, the company’s recent results signal a very positive shift in operational efficiency and margin expansion, prompting a reassessment of its financial trend from positive to very positive.
Read full news article Announcements
Disclosures under Reg. 29(2) of SEBI (SAST) Regulations 2011
05-Jun-2026 | Source : BSEThe Exchange has received the disclosure under Regulation 29(2) of SEBI (Substantial Acquisition of Shares & Takeovers) Regulations 2011 for Eswara Rao Nandam & PACs
Intimation Under Regulation 31A Of SEBI (LODR) Regulations 2015 - Submission Of Application For Reclassification Of Promoter With BSE Limited On March 30 2026
05-Jun-2026 | Source : BSEIntimation under Regulation 31A of SEBI (LODR) Regulations 2015 - Submission of Application for Reclassification of Promoter with BSE Limited on March 30 2026
Announcement under Regulation 30 (LODR)-Newspaper Publication
03-Jun-2026 | Source : BSENewspaper publication of Financial Results
Corporate Actions

No Upcoming Board Meetings

Padam Cotton Yarns Ltd has declared 10% dividend, ex-date: 23 Sep 25

Padam Cotton Yarns Ltd has announced 1:10 stock split, ex-date: 27 Jun 25

Padam Cotton Yarns Ltd has announced 2:3 bonus issue, ex-date: 18 Mar 25

Padam Cotton Yarns Ltd has announced 7:10 rights issue, ex-date: 24 Feb 26
Quality key factors
Valuation key factors
Technicals key factors
 Technical Indicator Scale: Bearish, Mildly Bearish, Sideways, Mildly Bullish, Bullish Turned
 Shareholding Snapshot : Mar 2026
Shareholding Compare (%holding)
Non Institution
None
Held by 0 Schemes
Held by 0 FIIs
Rajev Gupta Huf (0.0%)
Anju Gupta (6.6%)
70.6%
Quarterly Results Snapshot (Standalone) - Mar'26 - YoY

YoY Growth in quarter ended Mar 2026 is 86.19% vs 0.00% in Mar 2025

YoY Growth in quarter ended Mar 2026 is 91.59% vs 710.81% in Mar 2025
Half Yearly Results Snapshot (Standalone) - Sep'25
Growth in half year ended Sep 2025 is 0.00% vs 0.00% in Sep 2024
Growth in half year ended Sep 2025 is 32.20% vs 1,253.57% in Sep 2024
Nine Monthly Results Snapshot (Standalone) - Dec'25
YoY Growth in nine months ended Dec 2025 is 4,312.61% vs 0.00% in Dec 2024
YoY Growth in nine months ended Dec 2025 is -20.77% vs 312.38% in Dec 2024
Annual Results Snapshot (Standalone) - Mar'26
YoY Growth in year ended Mar 2026 is 416.10% vs 0.00% in Mar 2025
YoY Growth in year ended Mar 2026 is 3.11% vs 542.42% in Mar 2025
About Padam Cotton Yarns Ltd

Company Coordinates


