
Compare Palash Securi. with Similar Stocks
Total Returns (Price + Dividend) 
Palash Securi. for the last several years.
Risk Adjusted Returns v/s
Returns Beta

News

Palash Securities Ltd is Rated Sell by MarketsMOJO
Palash Securities Ltd is rated 'Sell' by MarketsMOJO, with this rating last updated on 18 May 2026. However, the analysis and financial metrics discussed here reflect the stock's current position as of 09 July 2026, providing investors with an up-to-date perspective on the company’s fundamentals, valuation, financial trends, and technical outlook.
Read full news article
Palash Securities Ltd is Rated Sell
Palash Securities Ltd is rated 'Sell' by MarketsMOJO, with this rating last updated on 18 May 2026. However, the analysis and financial metrics discussed here reflect the stock's current position as of 28 June 2026, providing investors with the latest insights into the company’s performance and outlook.
Read full news article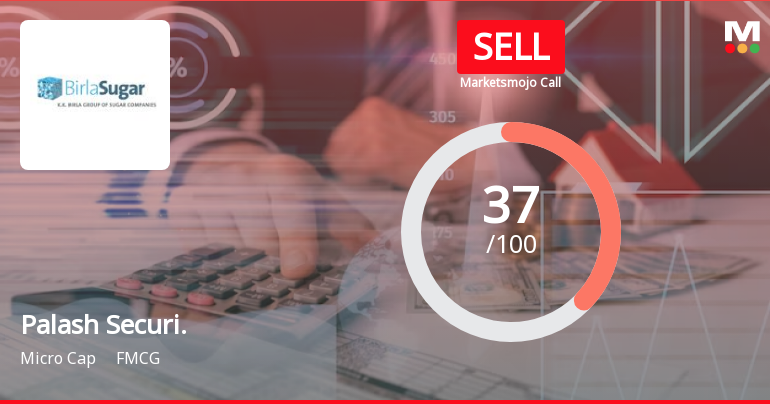
Palash Securities Ltd is Rated Sell
Palash Securities Ltd is rated 'Sell' by MarketsMOJO, with this rating last updated on 18 May 2026. However, the analysis and financial metrics discussed here reflect the stock's current position as of 16 June 2026, providing investors with the most up-to-date view of the company’s performance and outlook.
Read full news article Announcements
Compliances-Certificate under Reg. 74 (5) of SEBI (DP) Regulations 2018
14-Jul-2026 | Source : BSECertificate Under Regulation 74(5) of SEBI (DP) Regulations 2018
Announcement under Regulation 30 (LODR)-Newspaper Publication
14-Jul-2026 | Source : BSECopy of Newspaper publication
Letter To The Shareholders In Terms Of Regulation 36 (1)(B) Of SEBI Listing Obligations And Disclosures Requirements) Regulation 2015
13-Jul-2026 | Source : BSELetter to Shareholders providing Weblink to the Notice of the Annual General Meeting and Annual Report for the Financial Year 2025-26.
Corporate Actions

No Upcoming Board Meetings

No Dividend history available

No Splits history available

No Bonus history available

No Rights history available
Quality key factors
Valuation key factors
Technicals key factors
 Technical Indicator Scale: Bearish, Mildly Bearish, Sideways, Mildly Bullish, Bullish Turned
 Shareholding Snapshot : Mar 2026
Shareholding Compare (%holding)
Promoters
None
Held by 3 Schemes (0.01%)
Held by 0 FIIs
Ganges Securities Limited (12.83%)
Ashish Bharatkumar Shah (3.23%)
20.0%
Quarterly Results Snapshot (Consolidated) - Mar'26 - YoY

YoY Growth in quarter ended Mar 2026 is -99.13% vs 44.70% in Mar 2025

YoY Growth in quarter ended Mar 2026 is 44.87% vs -128.27% in Mar 2025
Half Yearly Results Snapshot (Consolidated) - Sep'25
Growth in half year ended Sep 2025 is 76.03% vs -1.82% in Sep 2024
Growth in half year ended Sep 2025 is 42.64% vs 3.49% in Sep 2024
Nine Monthly Results Snapshot (Consolidated) - Dec'25
YoY Growth in nine months ended Dec 2025 is 40.20% vs 11.52% in Dec 2024
YoY Growth in nine months ended Dec 2025 is 492.43% vs 18.51% in Dec 2024
Annual Results Snapshot (Consolidated) - Mar'26
YoY Growth in year ended Mar 2026 is 0.84% vs 19.24% in Mar 2025
YoY Growth in year ended Mar 2026 is 226.94% vs -31.60% in Mar 2025
About Palash Securities Ltd

Company Coordinates


