
Compare Palm Jewels with Similar Stocks
Dashboard
Weak Long Term Fundamental Strength with an average Return on Equity (ROE) of 3.37%
- Poor long term growth as Net Sales has grown by an annual rate of 12.52% and Operating profit at 9.02% over the last 5 years
- Company's ability to service its debt is weak with a poor EBIT to Interest (avg) ratio of 0.75
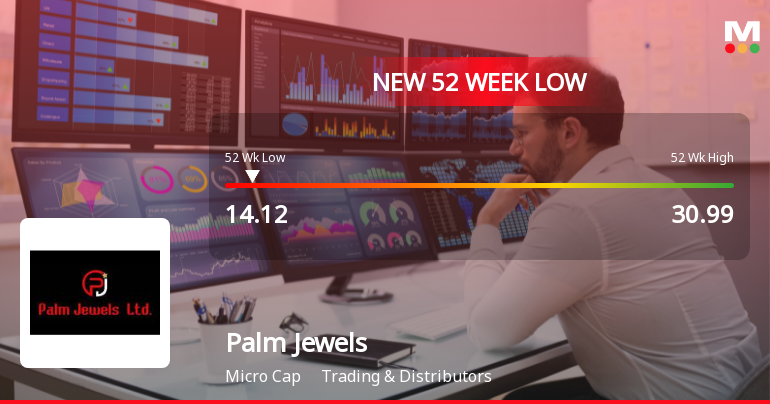
Flat results in Mar 26
Below par performance in long term as well as near term
Stock DNA
Trading & Distributors
INR 15 Cr (Micro Cap)
15.00
52
0.00%
0.15
6.01%
0.94
Total Returns (Price + Dividend) 
Palm Jewels for the last several years.
Risk Adjusted Returns v/s
Returns Beta

News

Palm Jewels Ltd Downgraded to Strong Sell Amid Weak Fundamentals and Bearish Technicals
Palm Jewels Ltd, a micro-cap player in the Diamond & Gold Jewellery sector, has seen its investment rating downgraded from Sell to Strong Sell as of 22 June 2026. This shift reflects a deterioration in technical indicators despite an improved valuation profile, alongside flat financial trends and weak quality metrics, signalling caution for investors amid challenging market conditions.
Read full news article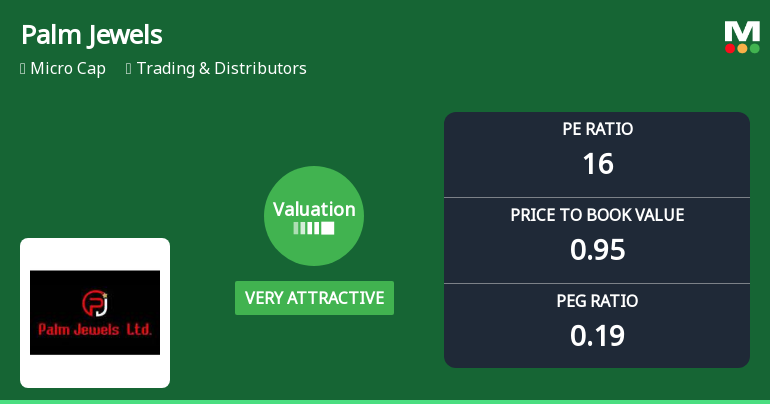
Palm Jewels Ltd Valuation Shifts Signal Renewed Price Attractiveness Amid Mixed Returns
Palm Jewels Ltd, a micro-cap player in the Trading & Distributors sector, has witnessed a notable improvement in its valuation parameters, shifting from an attractive to a very attractive rating. This change comes amid a mixed performance backdrop and evolving market sentiment, prompting investors to reassess the stock’s price appeal relative to its historical and peer benchmarks.
Read full news article Announcements
Compliances-Certificate under Reg. 74 (5) of SEBI (DP) Regulations 2018
06-Jul-2026 | Source : BSEPursuant to Regulation 74(5) of Securities and Exchange Board Of India (Depositories and Participants) Regulations 2018 for the quarter ended 30th June 2026.
Closure of Trading Window
01-Jul-2026 | Source : BSEPursuant to the provisions of the SEBI (PIT) Regulations 2015 (as amended from time to time) intimation of Closure of Trading Window is attached herewith.
Disclosures under Reg. 29(2) of SEBI (SAST) Regulations 2011
03-Jun-2026 | Source : BSEThe Exchange has received the disclosure under Regulation 29(2) of SEBI (Substantial Acquisition of Shares & Takeovers) Regulations 2011 for Veeram Barter Pvt Ltd & PAC
Corporate Actions

No Upcoming Board Meetings

No Dividend history available

No Splits history available

Palm Jewels Ltd has announced 36:100 bonus issue, ex-date: 26 Mar 20

No Rights history available
Quality key factors
Valuation key factors
Technicals key factors
 Technical Indicator Scale: Bearish, Mildly Bearish, Sideways, Mildly Bullish, Bullish Turned
 Shareholding Snapshot : Jun 2026
Shareholding Compare (%holding)
Non Institution
None
Held by 0 Schemes
Held by 0 FIIs
Rohit Dalpatbhai Shah (36.12%)
Vivid Mercantile Limited (11.01%)
22.92%
Quarterly Results Snapshot (Standalone) - Mar'26 - QoQ

QoQ Growth in quarter ended Mar 2026 is -15.40% vs 39.94% in Dec 2025
QoQ Growth in quarter ended Mar 2026 is -62.50% vs 110.53% in Dec 2025
Half Yearly Results Snapshot (Standalone) - Sep'25
Growth in half year ended Sep 2025 is -5.15% vs 29.22% in Sep 2024
Growth in half year ended Sep 2025 is 15.79% vs 123.53% in Sep 2024
Nine Monthly Results Snapshot (Standalone) - Dec'25
YoY Growth in nine months ended Dec 2025 is -10.58% vs 26.46% in Dec 2024

YoY Growth in nine months ended Dec 2025 is 78.72% vs 67.86% in Dec 2024
Annual Results Snapshot (Standalone) - Mar'26
YoY Growth in year ended Mar 2026 is -2.35% vs 18.20% in Mar 2025
YoY Growth in year ended Mar 2026 is 85.19% vs 54.29% in Mar 2025
About Palm Jewels Ltd

Company Coordinates


