
Compare Palred Technolog with Similar Stocks
Dashboard
With a Operating Losses, the company has a Weak Long Term Fundamental Strength
- Company's ability to service its debt is weak with a poor EBIT to Interest (avg) ratio of -0.52
- The company has reported losses. Due to this company has reported negative ROE
Flat results in Mar 26
Risky - Negative EBITDA
Consistent Underperformance against the benchmark over the last 3 years
Stock DNA
Computers - Software & Consulting
INR 54 Cr (Micro Cap)
NA (Loss Making)
19
0.00%
0.08
-12.21%
1.27
Total Returns (Price + Dividend) 
Latest dividend: 58 per share ex-dividend date: Oct-17-2013
Risk Adjusted Returns v/s
Returns Beta

News
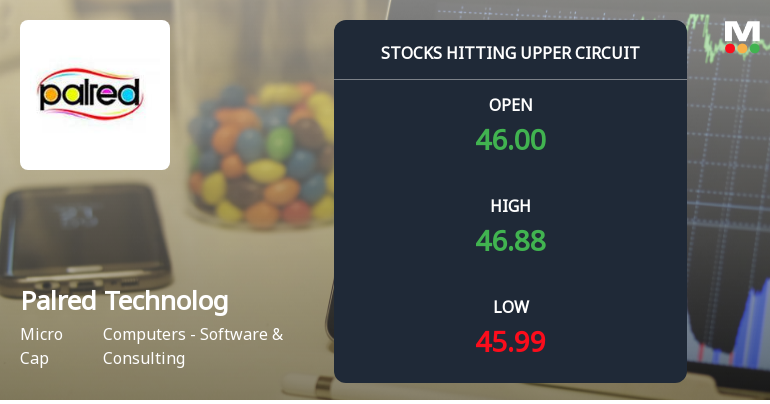
Palred Technologies Ltd Locks at Upper Circuit With 5.0% Gain — Buyers Queue, Sellers Absent
At Rs 46.20, the buying was done — not because demand dried up, but because the exchange wouldn't let the stock go any higher. Palred Technologies Ltd locked at its upper circuit of 5.0% on 29 Jul 2026, with buyers queuing and no sellers willing to part with shares.
Read full news article
Palred Technologies Ltd is Rated Sell
Palred Technologies Ltd is rated Sell by MarketsMOJO. This rating was last updated on 11 June 2026, reflecting a shift from a previous 'Strong Sell' stance. However, the analysis and financial metrics discussed here represent the stock's current position as of 28 July 2026, providing investors with an up-to-date perspective on the company’s fundamentals and market performance.
Read full news article
Upper Circuit at Rs 47.5: Is Palred Technologies Ltd’s 5% Surge Driven by Conviction or Thin Liquidity?
At Rs 47.5, the buying was done — not because demand dried up, but because the exchange wouldn't allow the stock to rise further. Palred Technologies Ltd locked at its upper circuit of 5% on 28 Jul 2026, with buyers queuing and no sellers willing to part with shares, highlighting unfilled demand in a micro-cap context.
Read full news article Announcements
Compliances-Certificate under Reg. 74 (5) of SEBI (DP) Regulations 2018
09-Jul-2026 | Source : BSECompliance certificate under Reg 74(5) pf SEBI (DP) Regulations 2018
Closure of Trading Window
24-Jun-2026 | Source : BSEClosure of Trading Window
Compliances-Reg.24(A)-Annual Secretarial Compliance
29-May-2026 | Source : BSESEBI Secretarial Compliance Report for the financial year 31.03.2026
Corporate Actions

No Upcoming Board Meetings

Palred Technologies Ltd has declared 580% dividend, ex-date: 17 Oct 13

Palred Technologies Ltd has announced 10:5 stock split, ex-date: 26 Apr 16

No Bonus history available

No Rights history available
Quality key factors
Valuation key factors
Technicals key factors
 Technical Indicator Scale: Bearish, Mildly Bearish, Sideways, Mildly Bullish, Bullish Turned
 Shareholding Snapshot : Jun 2026
Shareholding Compare (%holding)
Non Institution
None
Held by 0 Schemes
Held by 0 FIIs
Supriya Reddy Palem (13.1%)
Mathew Cyriac (20.44%)
59.07%
Quarterly Results Snapshot (Consolidated) - Mar'26 - QoQ

QoQ Growth in quarter ended Mar 2026 is 20.80% vs -23.97% in Dec 2025
QoQ Growth in quarter ended Mar 2026 is 18.81% vs -12.22% in Dec 2025
Half Yearly Results Snapshot (Consolidated) - Sep'25
Growth in half year ended Sep 2025 is -22.05% vs -35.98% in Sep 2024
Growth in half year ended Sep 2025 is -53.57% vs -330.77% in Sep 2024
Nine Monthly Results Snapshot (Consolidated) - Dec'25
YoY Growth in nine months ended Dec 2025 is -18.78% vs -27.21% in Dec 2024
YoY Growth in nine months ended Dec 2025 is -14.99% vs -38.71% in Dec 2024
Annual Results Snapshot (Consolidated) - Mar'26
YoY Growth in year ended Mar 2026 is -9.89% vs -26.14% in Mar 2025
YoY Growth in year ended Mar 2026 is 32.09% vs -126.90% in Mar 2025
About Palred Technologies Ltd

Company Coordinates


