
Compare Pan Electronics with Similar Stocks
Dashboard
With a Negative Book Value, the company has a Weak Long Term Fundamental Strength
- Poor long term growth as Net Sales has grown by an annual rate of 34.06% and Operating profit at 0% over the last 5 years
- The company has a negative book value of Rs 27.71 crore
Flat results in Mar 26
Risky - Negative EBITDA
Below par performance in long term as well as near term
Stock DNA
Industrial Manufacturing
INR 12 Cr (Micro Cap)
NA (Loss Making)
56
0.00%
-1.35
7.54%
-0.40
Total Returns (Price + Dividend) 
Pan Electronics for the last several years.
Risk Adjusted Returns v/s
Returns Beta

News
Are Pan Electronics (India) Ltd latest results good or bad?
Pan Electronics (India) Ltd's latest financial results for the fourth quarter of FY26 reveal significant operational challenges. The company reported net sales of ₹0.53 crores, which reflects a substantial year-on-year decline of 78.54%. This sharp drop in revenue raises concerns about the company's market viability and suggests potential issues such as competitive pressures or operational disruptions. The net loss for the quarter was ₹0.78 crores, marking a drastic year-on-year decline of 239.13%. This indicates a continued struggle for profitability, as the company has now reported losses for seven consecutive quarters. The operating margin deteriorated to -90.57%, highlighting severe inefficiencies in cost management, where the company is losing approximately 91 paise for every rupee of revenue generated. Despite a sequential improvement in net sales of 20.45% from the previous quarter, the overall per...
Read full news article
Pan Electronics (India) Ltd Q4 FY26: Deepening Losses Signal Severe Operational Distress
Pan Electronics (India) Ltd., a micro-cap manufacturer of metallised dielectric films and capacitors, reported alarming fourth-quarter results for FY26 that underscore a company in severe operational distress. The Bengaluru-based firm posted a net loss of ₹0.78 crores in Q4 FY26, marking a substantial deterioration from the ₹0.23 crore loss in the year-ago quarter. The stock, trading at ₹26.41 with a market capitalisation of just ₹11.00 crores, has plummeted 62.48% over the past year, reflecting investor exodus from what appears to be a structurally challenged business.
Read full news article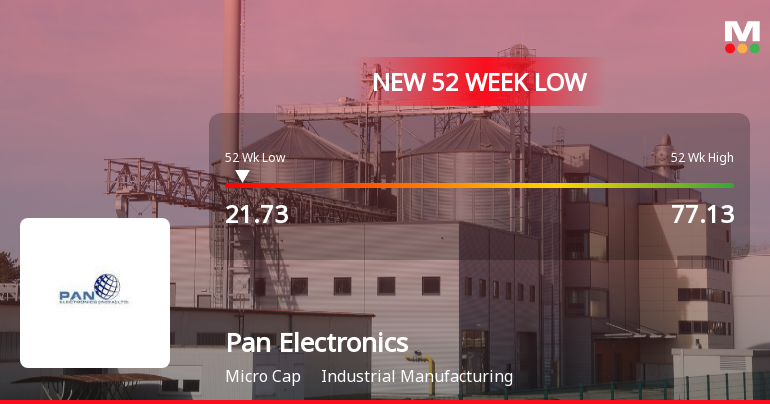
Announcements
Compliances-Certificate under Reg. 74 (5) of SEBI (DP) Regulations 2018
12-Jul-2026 | Source : BSEAs enclosed
Closure of Trading Window
21-Jun-2026 | Source : BSEClosure of trading window for the quarter ended June 30 2026
Announcement under Regulation 30 (LODR)-Newspaper Publication
30-May-2026 | Source : BSEPublication of Audited results for the year ended 31.03.2026
Corporate Actions

No Upcoming Board Meetings

No Dividend history available

No Splits history available

No Bonus history available

No Rights history available
Quality key factors
Valuation key factors
Technicals key factors
 Technical Indicator Scale: Bearish, Mildly Bearish, Sideways, Mildly Bullish, Bullish Turned
 Shareholding Snapshot : Jun 2026
Shareholding Compare (%holding)
Promoters
None
Held by 0 Schemes
Held by 0 FIIs
Gullu G Talreja (70.67%)
Devendra P. Solanki (3.43%)
26.87%
Quarterly Results Snapshot (Standalone) - Mar'26 - YoY

YoY Growth in quarter ended Mar 2026 is -78.54% vs 384.31% in Mar 2025
YoY Growth in quarter ended Mar 2026 is -239.13% vs 74.73% in Mar 2025
Half Yearly Results Snapshot (Standalone) - Sep'25

Growth in half year ended Sep 2025 is 78.79% vs 12.82% in Sep 2024
Growth in half year ended Sep 2025 is 70.31% vs -76.51% in Sep 2024
Nine Monthly Results Snapshot (Standalone) - Dec'25
YoY Growth in nine months ended Dec 2025 is 18.64% vs 37.21% in Dec 2024
YoY Growth in nine months ended Dec 2025 is 62.03% vs -61.21% in Dec 2024
Annual Results Snapshot (Standalone) - Mar'26
YoY Growth in year ended Mar 2026 is -31.06% vs 137.93% in Mar 2025
YoY Growth in year ended Mar 2026 is 44.12% vs -3.03% in Mar 2025
About Pan Electronics (India) Ltd

Company Coordinates


