
Compare Panabyte Tech with Similar Stocks
Dashboard
Weak Long Term Fundamental Strength with a -2.30% CAGR growth in Net Sales over the last 5 years
- Low ability to service debt as the company has a high Debt to EBITDA ratio of 3.50 times
- The company has been able to generate a Return on Equity (avg) of 1.01% signifying low profitability per unit of shareholders funds
Flat results in Mar 26
Below par performance in long term as well as near term
Stock DNA
Computers - Software & Consulting
INR 12 Cr (Micro Cap)
55.00
21
0.00%
0.45
2.90%
1.54
Total Returns (Price + Dividend) 
Latest dividend: 0.20000000000000004 per share ex-dividend date: Sep-19-2019
Risk Adjusted Returns v/s
Returns Beta

News

Panabyte Technologies Ltd Falls to 52-Week Low of Rs 17.8 as Sell-Off Deepens
A sharp decline has pushed Panabyte Technologies Ltd to a fresh 52-week low of Rs 17.8 on 9 Jun 2026, marking a 45.57% drop over the past year and underscoring persistent headwinds despite pockets of financial resilience.
Read full news article
Five Consecutive Losses Push Panabyte Technologies Ltd to a New 52-Week Low
For the ninth consecutive session, Panabyte Technologies Ltd has closed lower, culminating in a fresh 52-week low of Rs 18 on 8 Jun 2026. This persistent decline has dragged the stock down by 31.66% over this period, reflecting sustained selling pressure amid a challenging market backdrop.
Read full news article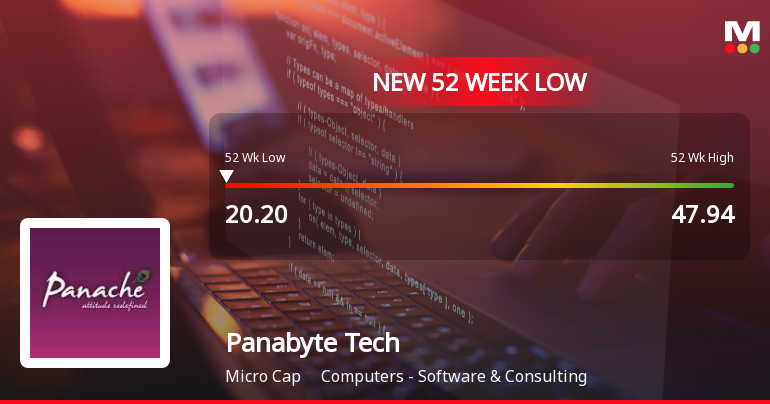
Panabyte Technologies Ltd Falls to 52-Week Low of Rs 20.2 as Sell-Off Deepens
For the sixth consecutive session, Panabyte Technologies Ltd has closed lower, culminating in a fresh 52-week low of Rs 20.2 on 3 Jun 2026. This marks a steep 23.31% decline over the past six days, extending the stock’s one-year loss to 40.76%, significantly underperforming the Sensex’s 8.97% fall over the same period.
Read full news article Announcements
Announcement under Regulation 30 (LODR)-Newspaper Publication
28-May-2026 | Source : BSEPublication of Newspaper Advertisement of Audited Financial Results for the Quarter and Year ended March 31 2026.
Announcement under Regulation 30 (LODR)-Change in Management
26-May-2026 | Source : BSEAppointment of Secretarial Auditors and Internal Auditors of the Company.
Results - Financial Results For Quarter And Year Ended March 31 2026.
26-May-2026 | Source : BSESubmission of Audited Financial Results for the quarter and year ended March 31 2026.
Corporate Actions

No Upcoming Board Meetings

Panabyte Technologies Ltd has declared 2% dividend, ex-date: 19 Sep 19

No Splits history available

No Bonus history available

No Rights history available
Quality key factors
Valuation key factors
Technicals key factors
 Technical Indicator Scale: Bearish, Mildly Bearish, Sideways, Mildly Bullish, Bullish Turned
 Shareholding Snapshot : Mar 2026
Shareholding Compare (%holding)
Non Institution
None
Held by 0 Schemes
Held by 0 FIIs
Hetal Mavji Vichhivora (1.45%)
Hbpa Tradex Private Limited (14.95%)
65.45%
Quarterly Results Snapshot (Standalone) - Mar'26 - QoQ

QoQ Growth in quarter ended Mar 2026 is 27.12% vs -38.33% in Dec 2025

QoQ Growth in quarter ended Mar 2026 is -750.00% vs -94.44% in Dec 2025
Half Yearly Results Snapshot (Standalone) - Sep'25
Growth in half year ended Sep 2025 is 52.58% vs 112.33% in Sep 2024
Growth in half year ended Sep 2025 is 283.33% vs 113.64% in Sep 2024
Nine Monthly Results Snapshot (Standalone) - Dec'25
YoY Growth in nine months ended Dec 2025 is -2.84% vs 176.45% in Dec 2024
YoY Growth in nine months ended Dec 2025 is 127.27% vs 120.37% in Dec 2024
Annual Results Snapshot (Standalone) - Mar'26
YoY Growth in year ended Mar 2026 is 5.04% vs 122.13% in Mar 2025
YoY Growth in year ended Mar 2026 is 33.33% vs 119.57% in Mar 2025
About Panabyte Technologies Ltd


