
Compare Panama Petrochem with Similar Stocks
Total Returns (Price + Dividend) 
Latest dividend: 3 per share ex-dividend date: Sep-02-2025
Risk Adjusted Returns v/s
Returns Beta

News
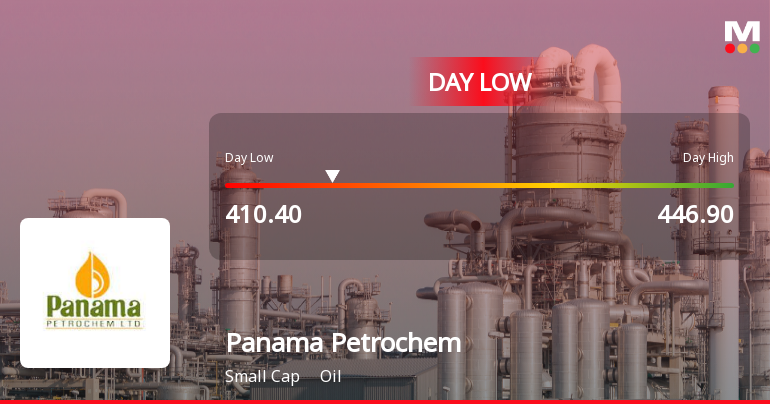
Panama Petrochem Ltd Hits Intraday Low Amid Price Pressure on 25 June 2026
Panama Petrochem Ltd experienced a significant intraday decline on 25 Jun 2026, touching a low of Rs 418.6, reflecting a 6.93% drop from previous levels. The stock underperformed its sector and broader market indices, continuing a three-day losing streak amid persistent price pressures.
Read full news article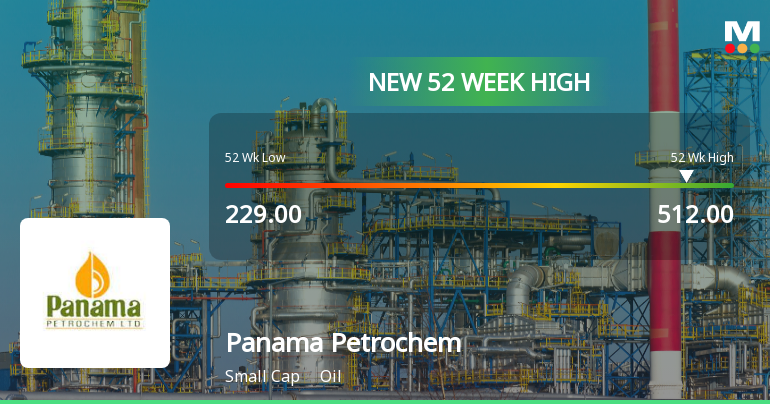
Broad-Based Technical Strength Lifts Panama Petrochem Ltd to 52-Week High of Rs 512
Surging to an all-time high of Rs 512 on 22 Jun 2026, Panama Petrochem Ltd has demonstrated robust price momentum, outpacing the broader market with a 30.7% gain over the past year against the Sensex’s decline of 6.4%. This milestone reflects a confluence of bullish technical indicators and sustained upward price trends.
Read full news article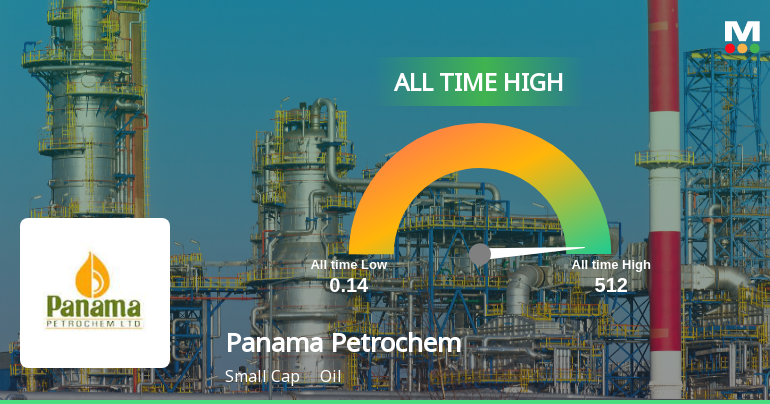
Panama Petrochem Ltd Hits All-Time High of Rs 512 as Momentum Builds Across Timeframes
Extending a remarkable rally that has spanned months, Panama Petrochem Ltd touched a fresh all-time high of Rs 512 on 22 Jun 2026, underscoring strong momentum across multiple timeframes despite a slight underperformance against its sector on the day.
Read full news article Announcements
Panama Petrochem Limited - Other General Purpose
18-Nov-2019 | Source : NSEPanama Petrochem Limited has informed the Exchange regarding Compliance under Regulation 23(9) of the Securities and Exchange Board of India (Listing Obligations and Disclosure Requirements) Regulations, 2015.
Panama Petrochem Limited - Updates
01-Nov-2019 | Source : NSEPanama Petrochem Limited has informed the Exchange regarding 'In continuation to our letter dated October 30, 2019 with regard to Board Meeting Notice, please find enclosed a copy of the advertisement published in English and regional (Gujarati ) newspapers.'.
Shareholders meeting
18-Sep-2019 | Source : NSE
| Revised Voting Results-Inadvertently, the no. of public shareholders present in the meeting was mentioned 22 in place of 32 in previous submission of voting results under Regulation 44(3). Hence , please take on record the attached revised results . |
Corporate Actions

No Upcoming Board Meetings

Panama Petrochem Ltd has declared 150% dividend, ex-date: 02 Sep 25

Panama Petrochem Ltd has announced 2:10 stock split, ex-date: 19 Sep 14

Panama Petrochem Ltd has announced 1:2 bonus issue, ex-date: 03 Oct 17

No Rights history available
Quality key factors
Valuation key factors
Technicals key factors
 Technical Indicator Scale: Bearish, Mildly Bearish, Sideways, Mildly Bullish, Bullish Turned
 Shareholding Snapshot : Mar 2026
Shareholding Compare (%holding)
Promoters
None
Held by 1 Schemes (0.0%)
Held by 45 FIIs (11.29%)
Amin Amirali Rayani (8.04%)
Connecor Investment Enterprise Ltd (3.72%)
16.34%
Quarterly Results Snapshot (Consolidated) - Mar'26 - QoQ

QoQ Growth in quarter ended Mar 2026 is 6.16% vs 0.24% in Dec 2025
QoQ Growth in quarter ended Mar 2026 is 55.16% vs -13.55% in Dec 2025
Half Yearly Results Snapshot (Consolidated) - Sep'25

Growth in half year ended Sep 2025 is 7.06% vs 24.07% in Sep 2024
Growth in half year ended Sep 2025 is 1.43% vs 1.56% in Sep 2024
Nine Monthly Results Snapshot (Consolidated) - Dec'25
YoY Growth in nine months ended Dec 2025 is 6.86% vs 29.82% in Dec 2024
YoY Growth in nine months ended Dec 2025 is -0.94% vs 6.40% in Dec 2024
Annual Results Snapshot (Consolidated) - Mar'26
YoY Growth in year ended Mar 2026 is 9.72% vs 18.51% in Mar 2025
YoY Growth in year ended Mar 2026 is 13.62% vs -4.16% in Mar 2025
About Panama Petrochem Ltd

Company Coordinates


