Panch.Organics

  • Market Cap: Micro Cap
  • Industry: Pharmaceuticals & Biotechnology
  • ISIN: INE316G01019
  • NSEID: PANCHSHEEL
  • BSEID: 531726
INR
114.30
-4.45 (-3.75%)
BSENSE

Jul 17, 03:30 PM

BSE+NSE Vol: 6.85 k

  • Price Points
  • Score
  • Mojo Parameters
  • Total Return
  • News and Corporate Actions
  • Key factors
  • Shareholding
  • Financials
  • CompanyCV
stock-summaryPrice Point
High/Low

1Day

52 Week

Valuation
Technical
Day's Volume

CASH

6.85 k (162.52%) Volume

Shareholding (Mar 2026)

FII

0.00%

Held by 0 FIIs

DII

0.00%

Held by 0 DIIs

Promoter

56.12%

Why is Panchsheel Organics Ltd falling/rising?

18-Jul-2026

As of 17-Jul, Panchsheel Organics Ltd's stock price is Rs 114.30, down 3.75%, and has significantly underperformed the Sensex, declining 12.01% year-to-date compared to the Sensex's 8.30% drop. The stock is on a downward trend, with consecutive losses and trading below its moving averages, indicating a bearish outlook.

As of 17-Jul, Panchsheel Organics Ltd's stock price is falling, currently at Rs 114.30, which reflects a decrease of Rs 4.45 or 3.75%. The stock has been underperforming significantly compared to the benchmark Sensex, with a decline of 6.62% over the past week while the Sensex has increased by 0.75%. Over the last month, the stock has dropped by 4.75%, contrasting with the Sensex's gain of 1.29%. Year-to-date, Panchsheel Organics Ltd has seen a decline of 12.01%, while the Sensex has fallen by only 8.30%. <BR><BR>The stock has been on a downward trend, experiencing consecutive losses for the last three days, resulting in an overall decline of 8.57% during this period. It also reached an intraday low of Rs 110.3, marking a decrease of 7.12%. Furthermore, the stock is trading below its moving averages across various time frames, indicating a bearish trend. Despite a slight increase in investor participation, with delivery volume rising by 0.3% against the 5-day average, the overall performance remains weak, as evidenced by the stock's underperformance against its sector by 4.23%.

View full answer

Should I buy, sell or hold Panchsheel Organics Ltd?

18-Jul-2026

How big is Panch.Organics?

11-Jun-2026

As of 10th June, Panchsheel Organics Ltd has a market capitalization of 158.00 Cr, with recent net sales of 106.68 Cr and a net profit of 10.84 Cr.

As of 10th June, Panchsheel Organics Ltd has a market capitalization of 158.00 Cr, categorizing it as a Micro Cap company.<BR><BR>In the latest four quarters, the company reported Net Sales of 106.68 Cr and a Net Profit of 10.84 Cr.<BR><BR>The latest annual period for the balance sheet is March 2025, with Shareholder's Funds amounting to 133.86 Cr and Total Assets of 162.18 Cr.

View full answer

Who are in the management team of Panch.Organics?

11-Jun-2026

The management team of Panch.Organics includes Mahendra Abhaychand Turakhia (Chairman & Managing Director), Kishore Abhaychand Turakhia (Whole-time Director), and several independent directors: Diwakar Mani Tripathi, Shambhnath Chakravarti, and Darshana Vishal Shah, along with Rajesh Turakhia (Director) and Nikhil Borana (Company Secretary & Compliance Officer).

The management team of Panch.Organics includes the following individuals:<BR><BR>1. Mahendra Abhaychand Turakhia - Chairman & Managing Director<BR>2. Kishore Abhaychand Turakhia - Whole-time Director<BR>3. Diwakar Mani Tripathi - Independent Director<BR>4. Shambhnath Chakravarti - Independent Director<BR>5. Darshana Vishal Shah - Independent Director<BR>6. Rajesh Turakhia - Director<BR>7. Nikhil Borana - Company Secretary & Compliance Officer<BR><BR>If you need more information about any specific member or their roles, feel free to ask!

View full answer

Who are the peers of the Panch.Organics?

11-Jun-2026

Panch.Organics' peers include Oxygenta Pharma, Coral Labs, Sanjiv.Parant, Kimia Bioscien, Achyut Healthcar, Natural Capsules, Auro Labs, and Quest Laborato. In terms of management risk, growth, and capital structure, Coral Labs and Quest Laborato show excellent performance, while Panch.Organics has an excellent capital structure but a 1-year return of -20.93%.

Peers: The peers of Panch.Organics are Oxygenta Pharma, Coral Labs., Sanjiv.Parant., Kimia Bioscien., Achyut Healthcar, Natural Capsules, Auro Labs., and Quest Laborato.<BR><BR>Quality Snapshot: Excellent management risk is observed at Coral Labs. and Quest Laborato., while Good management risk is found at Sanjiv.Parant. and the rest have Below Average or Average management risk. For Growth, Good growth is noted at Sanjiv.Parant. and Quest Laborato., while Average growth is found at Achyut Healthcar, and the rest have Below Average growth. In terms of Capital Structure, Excellent capital structure is seen at Panch.Organics and Quest Laborato., while Good capital structure is present at Achyut Healthcar, and the rest have Below Average or Average capital structure.<BR><BR>Return Snapshot: The peer with the highest 1-year return is Guj. Inject(Ker) at 427.17%, while Oxygenta Pharma has the lowest at -60.96%. Panch.Organics has a 1-year return of -20.93%, which is better than Oxygenta Pharma but worse than Guj. Inject(Ker). Additionally, peers such as Oxygenta Pharma, Kimia Bioscien., Natural Capsules, and Auro Labs. have negative six-month returns.

View full answer

What does Panch.Organics do?

10-Jun-2026

Panchsheel Organics Ltd is a manufacturer and exporter of Active Pharma Ingredients and Finished Formulations in the pharmaceutical industry, classified as a Micro Cap company with a market cap of INR 158 Cr. As of March 2026, it reported net sales of 31 Cr and a net profit of 2 Cr.

Overview:<BR>Panchsheel Organics Ltd is a manufacturer and exporter of Active Pharma Ingredients (APIs), Intermediates, and Finished Formulations in the Pharmaceuticals & Biotechnology industry, classified as a Micro Cap company.<BR><BR>History:<BR>Incorporated as a private limited company in 1989, Panchsheel Organics Limited was converted into a public limited company in 1992. The latest quarterly results reported net sales and profit for the period ending March 2026.<BR><BR>Financial Snapshot:<BR>Most recent Net Sales: 31 Cr (Quarterly Results - Mar 2026) <BR>Most recent Net Profit: 2 Cr (Quarterly Results - Mar 2026) <BR>Market-cap value: INR 158 Cr (Micro Cap)<BR><BR>Key Metrics:<BR>P/E: 14.00 <BR>Industry P/E: 34 <BR>Dividend Yield: 1.92% <BR>Debt-Equity: 0.01 <BR>Return on Equity: 7.70% <BR>Price to Book: 1.17 <BR><BR>Contact Details:<BR>Address: B-6 & B-7 Sector - C, Industrial Estate Sanwer Road Indore Madhya Pradesh : 452015 <BR>Tel: 91-0731-22432 734 <BR>Email: poltd@vsnl.com <BR>Website: http://www.panchsheelorganics.com

View full answer

Are Panchsheel Organics Ltd latest results good or bad?

02-Jun-2026

Panchsheel Organics Ltd's latest results show a concerning financial situation, with net profit down 46.40% despite a 16.24% increase in net sales. The significant decline in operating margin and increased reliance on non-operating income suggest underlying challenges in profitability.

Panchsheel Organics Ltd's latest results for Q4 FY26 indicate a challenging financial situation. While the company achieved a net sales figure of ₹31.07 crores, reflecting a 16.24% increase quarter-on-quarter and a 9.52% increase year-on-year, the net profit plummeted to ₹1.70 crores, down 46.40% from the previous quarter and 46.37% year-on-year. This significant drop in profit is concerning, especially given the revenue growth.<BR><BR>The operating margin, which fell to 7.82%, is the lowest in eight quarters, down from 14.14% in the previous quarter. This sharp decline suggests that the company is facing severe cost pressures or pricing challenges that are impacting profitability. Additionally, the company's reliance on non-operating income has increased, with other income constituting nearly 41% of profit before tax, raising questions about the sustainability of its earnings.<BR><BR>Overall, while there is some positive momentum in sales, the substantial decline in profitability and margins indicates that the company's financial health is under significant stress. Investors should approach this situation with caution, as the fundamentals suggest a deteriorating business model.

View full answer

When is the next results date for Panchsheel Organics Ltd?

27-May-2026

The next results date for Panchsheel Organics Ltd is 30 May 2026.

The next results date for Panchsheel Organics Ltd is scheduled for 30 May 2026.

View full answer

How has been the historical performance of Panch.Organics?

14-Nov-2025

Panch.Organics has shown steady growth in net sales, increasing from 49.49 crore in Mar'21 to 107.18 crore in Mar'25, but profitability metrics have fluctuated, with profit before tax declining from 19.39 crore in Mar'24 to 18.10 crore in Mar'25. Total assets rose significantly to 162.18 crore by Mar'25, despite challenges in cash management.

Answer:<BR>The historical performance of Panch.Organics shows a steady growth in net sales and profitability over the years, although there are fluctuations in certain metrics.<BR><BR>Breakdown:<BR>Panch.Organics has demonstrated consistent growth in net sales, increasing from 49.49 crore in Mar'21 to 107.18 crore in Mar'25. Total operating income followed a similar trend, reaching 107.18 crore in Mar'25, up from 48.23 crore in Mar'19. The company's total expenditure also rose, from 40.84 crore in Mar'21 to 89.58 crore in Mar'25, reflecting higher raw material costs and other expenses. Operating profit (PBDIT) peaked at 20.67 crore in Mar'25, although it slightly declined from 21.40 crore in Mar'24. Profit before tax was 18.10 crore in Mar'25, down from 19.39 crore in Mar'24, while profit after tax was 13.79 crore, showing a slight decrease from 14.11 crore in the previous year. The company's total assets increased significantly from 51.37 crore in Mar'20 to 162.18 crore in Mar'25, with total liabilities also rising to 162.18 crore. Cash flow from operating activities was positive at 3.00 crore in Mar'25, but the net cash outflow was -17.00 crore, indicating challenges in cash management. Overall, while Panch.Organics has shown growth in sales and assets, profitability metrics have experienced some volatility.

View full answer

Who are the top shareholders of the Panch.Organics?

17-Jul-2025

The top shareholders of Panch.Organics include promoters, with Rajesh Abhaychand Turakhia holding 16.16%, and individual investors who collectively own 32.38%. There are no mutual funds or foreign institutional investors involved.

The top shareholders of Panch.Organics primarily include the promoters, with Rajesh Abhaychand Turakhia holding the highest stake at 16.16%. Additionally, individual investors collectively hold 32.38% of the shares. There are currently no mutual funds or foreign institutional investors involved in the company's shareholding.

View full answer

Is Panch.Organics overvalued or undervalued?

09-Jun-2025

As of February 14, 2025, Panch.Organics is considered very attractive and undervalued, with a PE Ratio of 14.52, a strong growth potential indicated by a PEG Ratio of 0.00, a dividend yield of 2.58%, and a long-term return of 516.40% over five years, despite recent underperformance compared to the Sensex.

As of 14 February 2025, the valuation grade for Panch.Organics moved from attractive to very attractive, indicating a significant improvement in its perceived value. The company is currently assessed as undervalued, supported by key ratios such as a PE Ratio of 14.52, an EV to EBITDA of 10.87, and a PEG Ratio of 0.00, which suggests strong growth potential relative to its price. <BR><BR>In comparison to its peers, Panch.Organics stands out with a much lower PE Ratio than Sun Pharma.Inds. at 35.25 and Divi's Lab. at 79.33, both of which are categorized as expensive. Additionally, the company's dividend yield of 2.58% and ROCE of 12.37% further reinforce its attractive valuation. Despite recent underperformance relative to the Sensex over the past year, the long-term return of 516.40% over five years highlights its potential for future growth.

View full answer

What is the technical trend for Panch.Organics?

09-Jun-2025

As of May 19, 2025, Panch.Organics exhibits a mildly bearish trend overall, influenced by daily moving averages and a bearish monthly MACD, despite some mildly bullish indicators on the weekly MACD and KST.

As of 19 May 2025, the technical trend for Panch.Organics has changed from bearish to mildly bearish. The weekly MACD indicates a mildly bullish stance, while the monthly MACD remains bearish. The moving averages on the daily chart are mildly bearish, and the Bollinger Bands show a mildly bearish trend on both weekly and monthly time frames. The KST is mildly bullish weekly but bearish monthly, and Dow Theory aligns with a mildly bullish weekly perspective but is bearish monthly. Overall, the current stance is mildly bearish, driven primarily by the daily moving averages and the monthly MACD.

View full answer

What is the bonus history of the Panch.Organics?

06-Jun-2025

Panch.Organics issued a 1:1 bonus on December 6, 2021, with a record date of December 7, 2021, granting shareholders one additional share for each share held.

Panch.Organics has a bonus history that includes a 1:1 bonus issue announced on December 6, 2021. The record date for this bonus was December 7, 2021. This means that shareholders received one additional share for every share they held as of the record date.

View full answer

Has Panch.Organics declared dividend?

06-Jun-2025

Yes, Panchsheel Organics Ltd has declared an 8% dividend, amounting to 0.8 per share, with an ex-date of June 6, 2025. Recent total returns show volatility, with significant gains over longer periods despite negative returns in the short term.

Panchsheel Organics Ltd has declared an 8% dividend.<BR><BR>Dividend Details:<BR>- Percentage announced: 8%<BR>- Amount per share: 0.8<BR>- Ex-date: 06 Jun 25<BR><BR>Dividend Yield: 2.05%.<BR><BR>Total Returns by Period:<BR>Over the last 6 months, the price return was -31.13%, the dividend return was 0.72%, resulting in a total return of -30.41%.<BR><BR>In the past year, the price return was -16.76%, the dividend return was 2.15%, leading to a total return of -14.61%.<BR><BR>Over a 2-year period, the price return was -11.89%, with a dividend return of 3.84%, resulting in a total return of -8.05%.<BR><BR>For the 3-year period, the price return was -25.09%, the dividend return was 5.99%, culminating in a total return of -19.1%.<BR><BR>In the last 4 years, the price return was 209.13%, the dividend return was 22.76%, yielding a total return of 231.89%.<BR><BR>Over the 5-year period, the price return was 507.65%, with a dividend return of 46.90%, resulting in a total return of 554.55%.<BR><BR>Overall, while Panchsheel Organics Ltd has declared a dividend, the recent total returns indicate significant volatility, particularly in the shorter time frames, with substantial gains observed over the longer term.

View full answer
iScoreScore
Click here to find our call on this stock
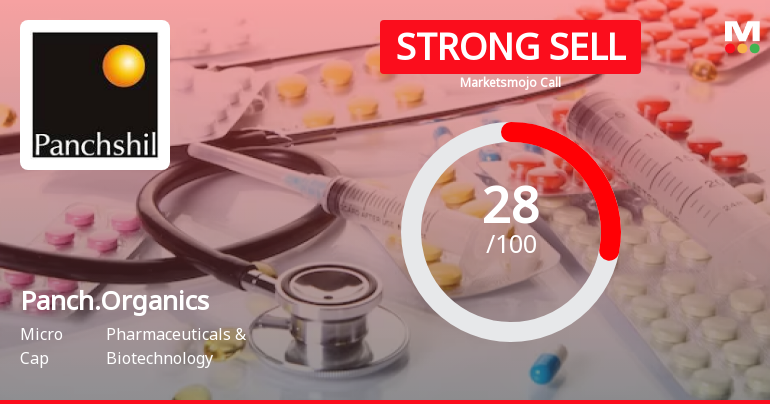
Strong Sell
Sell
Hold
Buy
Strong Buy

Dashboard

1

Poor long term growth as Operating profit has grown by an annual rate 8.05% of over the last 5 years

 
2

Negative results in Mar 26

3

Below par performance in long term as well as near term

stock-summaryMojo Parameters

Mojo Parameters

Loading Valuation Snapshot...

Stock DNA

stock-summary
Industry

Pharmaceuticals & Biotechnology

stock-summary
Market cap

INR 157 Cr (Micro Cap)

stock-summary
P/E

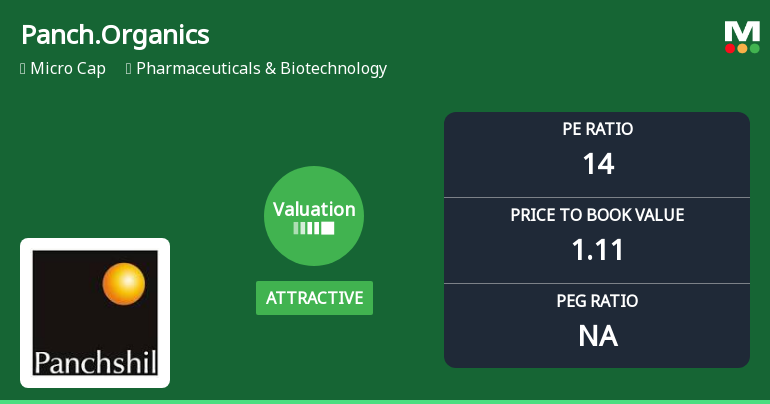
14.00

stock-summary
Industry P/E

36

stock-summary
Dividend Yield

2.71%

stock-summary
Debt Equity

0.01

stock-summary
Return on Equity

7.70%

stock-summary
Price to Book

1.11

Revenue and Profits:
Net Sales:
31 Cr
(Quarterly Results - Mar 2026)
Net Profit:
2 Cr
stock-summaryTotal Returns
Total Returns (Price + Dividend) stock-summary
Dividend Yield (2.71%)
TimePeriod
Price Return
Dividend Return
Total Return
3 Months
-7.42%
0.65%
-6.77%
6 Months
-3.95%
1.42%
-2.53%
1 Year
-19.65%
2.25%
-17.4%
2 Years
-56.88%
2.63%
-54.25%
3 Years
-31.96%
5.19%
-26.77%
4 Years
-45.35%
5.63%
-39.72%
5 Years
123.68%
26.76%
150.44%

Latest dividend: 0.8175559380378657 per share ex-dividend date: Jun-12-2026

Risk Adjusted Returns v/s stock-summary
Returns Beta
Icon
Beta has not been calculated since enough price history is not available
stock-summaryNews & Corporate Actions

Announcements stock-summary

Compliances-Certificate under Reg. 74 (5) of SEBI (DP) Regulations 2018

06-Jul-2026 | Source : BSE

Certificate under Regulation-74(5) of Securities and Exchange Board of India (DP) Regulations 2018 for the quarter ended 30th June 2026.

Closure of Trading Window

27-Jun-2026 | Source : BSE

Intimation of Trading window closure for the declaration of unaudited quarterly results for the quarter ended 30th June 2026 of Panchsheel Organics Limited.

Announcement under Regulation 30 (LODR)-Newspaper Publication

01-Jun-2026 | Source : BSE

Announcement under Regulation-30(LODR)- Newspaper Publication of financial results of the Panchsheel Organics Limited for the quarter and year ended 31st March 2026 approved by the board in the meeting held on 30th May 2026.

Corporate Actions stock-summary

stock-summary
BOARD MEETING

No Upcoming Board Meetings

stock-summary
DIVIDEND

Panchsheel Organics Ltd has declared 8% dividend, ex-date: 12 Jun 26

stock-summary
SPLITS

No Splits history available

stock-summary
BONUS

Panchsheel Organics Ltd has announced 1:1 bonus issue, ex-date: 06 Dec 21

stock-summary
RIGHTS

No Rights history available

stock-summaryKey Factors

Quality key factors stock-summary

Factor
Value
Sales Growth (5y)
16.60%
EBIT Growth (5y)
8.05%
EBIT to Interest (avg)
15.01
Debt to EBITDA (avg)
0.44
Net Debt to Equity (avg)
0.01
Sales to Capital Employed (avg)
0.90
Tax Ratio
25.09%
Dividend Payout Ratio
7.64%
Pledged Shares
0
Institutional Holding
0
ROCE (avg)
16.83%
ROE (avg)
12.35%

Valuation key factors

Factor
Value
P/E Ratio
14
Industry P/E
36
Price to Book Value
1.05
EV to EBIT
13.44
EV to EBITDA
11.11
EV to Capital Employed
1.05
EV to Sales
1.40
PEG Ratio
NA
Dividend Yield
2.86%
ROCE (Latest)
7.80%
ROE (Latest)
7.70%

Technicals key factors

Indicator
Weekly
Monthly
MACD
Bearish
Bearish
RSI
No Signal
No Signal
Bollinger Bands
Bearish
Bearish
Moving Averages
Mildly Bullish (Daily)
KST
Bullish
Bearish
Dow Theory
Mildly Bearish
Mildly Bullish
stock-summary Technical Indicator Scale: Bearish, Mildly Bearish, Sideways, Mildly Bullish, Bullish  Turned 
stock-summaryShareholding
Shareholding Snapshot : Mar 2026stock-summary
Shareholding Compare (%holding) stock-summary
Majority shareholders

Promoters

Pledged Promoter Holdings

None

Mutual Funds

Held by 0 Schemes

FIIs

Held by 0 FIIs

Promoter with highest holding

Rajesh Abhaychand Turakhia (16.16%)

Highest Public shareholder

Michael Dsouza (1.94%)

Individual Investors Holdings

33.42%

stock-summaryFinancial
[
  {
    "link": "quarterly",
    "btn_text": "All Quarterly Results",
    "header": "Quarterly Results Snapshot (Standalone) - Mar'26 - YoY",
    "rhs": [
      {
        "prefix": "Net Sales ",
        "suffix": "YoY Growth in quarter ended Mar 2026 is 9.52% vs -9.27% in Mar 2025",
        "dir": 1
      },
      {
        "prefix": "Standalone Net Profit ",
        "suffix": "YoY Growth in quarter ended Mar 2026 is -46.37% vs 14.03% in Mar 2025",
        "dir": -1
      }
    ],
    "table": {
      "header": [
        "Mar'26",
        "Mar'25",
        "Change(%)"
      ],
      "body": [
        {
          "field": "Net Sales",
          "val1": "31.07",
          "val2": "28.37",
          "chgp": "9.52%",
          "chgp_class": "positive"
        },
        {
          "field": "Operating Profit (PBDIT) excl Other Income",
          "val1": "2.43",
          "val2": "4.77",
          "chgp": "-49.06%",
          "chgp_class": "negative"
        },
        {
          "field": "Interest",
          "val1": "0.04",
          "val2": "0.09",
          "chgp": "-55.56%",
          "chgp_class": "positive"
        },
        {
          "field": "Exceptional Items",
          "val1": "0.00",
          "val2": "0.00",
          "chgp": "",
          "chgp_class": "neutral"
        },
        {
          "field": "Standalone Net Profit",
          "val1": "1.70",
          "val2": "3.17",
          "chgp": "-46.37%",
          "chgp_class": "negative"
        },
        {
          "field": "Operating Profit Margin (Excl OI)",
          "val1": "7.82%",
          "val2": "16.81%",
          "chgp": "-8.99%",
          "chgp_class": "negative"
        }
      ]
    }
  },
  {
    "link": "half-yearly",
    "btn_text": "All Half Yearly Results",
    "header": "Half Yearly Results Snapshot (Standalone) - Sep'25",
    "rhs": [
      {
        "prefix": "Net Sales ",
        "suffix": " Growth in half year ended Sep 2025 is -8.19% vs 10.14% in Sep 2024",
        "dir": -1
      },
      {
        "prefix": "Standalone Net Profit ",
        "suffix": " Growth in half year ended Sep 2025 is -24.41% vs 1.98% in Sep 2024",
        "dir": -1
      }
    ],
    "table": {
      "header": [
        "Sep'25",
        "Sep'24",
        "Change(%)"
      ],
      "body": [
        {
          "field": "Net Sales",
          "val1": "48.88",
          "val2": "53.24",
          "chgp": "-8.19%",
          "chgp_class": "negative"
        },
        {
          "field": "Operating Profit (PBDIT) excl Other Income",
          "val1": "7.24",
          "val2": "9.56",
          "chgp": "-24.27%",
          "chgp_class": "negative"
        },
        {
          "field": "Interest",
          "val1": "0.14",
          "val2": "0.20",
          "chgp": "-30.00%",
          "chgp_class": "positive"
        },
        {
          "field": "Exceptional Items",
          "val1": "0.00",
          "val2": "0.00",
          "chgp": "",
          "chgp_class": "neutral"
        },
        {
          "field": "Standalone Net Profit",
          "val1": "5.45",
          "val2": "7.21",
          "chgp": "-24.41%",
          "chgp_class": "negative"
        },
        {
          "field": "Operating Profit Margin (Excl OI)",
          "val1": "14.81%",
          "val2": "17.96%",
          "chgp": "-3.15%",
          "chgp_class": "negative"
        }
      ]
    }
  },
  {
    "link": "nine-monthly",
    "btn_text": "All Nine Monthly Results",
    "header": "Nine Monthly Results Snapshot (Standalone) - Dec'25",
    "rhs": [
      {
        "prefix": "Net Sales ",
        "suffix": "YoY Growth in nine months ended Dec 2025 is -4.87% vs 7.48% in Dec 2024",
        "dir": -1
      },
      {
        "prefix": "Standalone Net Profit ",
        "suffix": "YoY Growth in nine months ended Dec 2025 is -16.08% vs -3.97% in Dec 2024",
        "dir": -1
      }
    ],
    "table": {
      "header": [
        "Dec'25",
        "Dec'24",
        "Change(%)"
      ],
      "body": [
        {
          "field": "Net Sales",
          "val1": "75.61",
          "val2": "79.48",
          "chgp": "-4.87%",
          "chgp_class": "negative"
        },
        {
          "field": "Operating Profit (PBDIT) excl Other Income",
          "val1": "11.02",
          "val2": "14.10",
          "chgp": "-21.84%",
          "chgp_class": "negative"
        },
        {
          "field": "Interest",
          "val1": "0.23",
          "val2": "0.28",
          "chgp": "-17.86%",
          "chgp_class": "positive"
        },
        {
          "field": "Exceptional Items",
          "val1": "0.00",
          "val2": "0.00",
          "chgp": "",
          "chgp_class": "neutral"
        },
        {
          "field": "Standalone Net Profit",
          "val1": "9.13",
          "val2": "10.88",
          "chgp": "-16.08%",
          "chgp_class": "negative"
        },
        {
          "field": "Operating Profit Margin (Excl OI)",
          "val1": "14.57%",
          "val2": "17.74%",
          "chgp": "-3.17%",
          "chgp_class": "negative"
        }
      ]
    }
  },
  {
    "link": "annual",
    "btn_text": "All Annual Results",
    "header": "Annual Results Snapshot (Standalone) - Mar'26",
    "rhs": [
      {
        "prefix": "Net Sales ",
        "suffix": "YoY Growth in year ended Mar 2026 is -0.37% vs 1.86% in Mar 2025",
        "dir": -1
      },
      {
        "prefix": "Standalone Net Profit ",
        "suffix": "YoY Growth in year ended Mar 2026 is -21.46% vs -2.27% in Mar 2025",
        "dir": -1
      }
    ],
    "table": {
      "header": [
        "Mar'26",
        "Mar'25",
        "Change(%)"
      ],
      "body": [
        {
          "field": "Net Sales",
          "val1": "106.78",
          "val2": "107.18",
          "chgp": "-0.37%",
          "chgp_class": "negative"
        },
        {
          "field": "Operating Profit (PBDIT) excl Other Income",
          "val1": "13.52",
          "val2": "17.60",
          "chgp": "-23.18%",
          "chgp_class": "negative"
        },
        {
          "field": "Interest",
          "val1": "0.24",
          "val2": "0.37",
          "chgp": "-35.14%",
          "chgp_class": "positive"
        },
        {
          "field": "Exceptional Items",
          "val1": "0.00",
          "val2": "0.00",
          "chgp": "",
          "chgp_class": "neutral"
        },
        {
          "field": "Standalone Net Profit",
          "val1": "10.83",
          "val2": "13.79",
          "chgp": "-21.46%",
          "chgp_class": "negative"
        },
        {
          "field": "Operating Profit Margin (Excl OI)",
          "val1": "12.66%",
          "val2": "16.42%",
          "chgp": "-3.76%",
          "chgp_class": "negative"
        }
      ]
    }
  }
]

Quarterly Results Snapshot (Standalone) - Mar'26 - YoYstock-summary

Mar'26
Mar'25
Change(%)
Net Sales
31.07
28.37
9.52%
Operating Profit (PBDIT) excl Other Income
2.43
4.77
-49.06%
Interest
0.04
0.09
-55.56%
Exceptional Items
0.00
0.00
Standalone Net Profit
1.70
3.17
-46.37%
Operating Profit Margin (Excl OI)
7.82%
16.81%
-8.99%
Values in Rs Cr.
Direction Arrows
Net Sales

YoY Growth in quarter ended Mar 2026 is 9.52% vs -9.27% in Mar 2025

Direction Arrows
Standalone Net Profit

YoY Growth in quarter ended Mar 2026 is -46.37% vs 14.03% in Mar 2025

Half Yearly Results Snapshot (Standalone) - Sep'25stock-summary

Sep'25
Sep'24
Change(%)
Net Sales
48.88
53.24
-8.19%
Operating Profit (PBDIT) excl Other Income
7.24
9.56
-24.27%
Interest
0.14
0.20
-30.00%
Exceptional Items
0.00
0.00
Standalone Net Profit
5.45
7.21
-24.41%
Operating Profit Margin (Excl OI)
14.81%
17.96%
-3.15%
Values in Rs Cr.
Direction Arrows
Net Sales

Growth in half year ended Sep 2025 is -8.19% vs 10.14% in Sep 2024

Direction Arrows
Standalone Net Profit

Growth in half year ended Sep 2025 is -24.41% vs 1.98% in Sep 2024

Nine Monthly Results Snapshot (Standalone) - Dec'25stock-summary

Dec'25
Dec'24
Change(%)
Net Sales
75.61
79.48
-4.87%
Operating Profit (PBDIT) excl Other Income
11.02
14.10
-21.84%
Interest
0.23
0.28
-17.86%
Exceptional Items
0.00
0.00
Standalone Net Profit
9.13
10.88
-16.08%
Operating Profit Margin (Excl OI)
14.57%
17.74%
-3.17%
Values in Rs Cr.
Direction Arrows
Net Sales

YoY Growth in nine months ended Dec 2025 is -4.87% vs 7.48% in Dec 2024

Direction Arrows
Standalone Net Profit

YoY Growth in nine months ended Dec 2025 is -16.08% vs -3.97% in Dec 2024

Annual Results Snapshot (Standalone) - Mar'26stock-summary

Mar'26
Mar'25
Change(%)
Net Sales
106.78
107.18
-0.37%
Operating Profit (PBDIT) excl Other Income
13.52
17.60
-23.18%
Interest
0.24
0.37
-35.14%
Exceptional Items
0.00
0.00
Standalone Net Profit
10.83
13.79
-21.46%
Operating Profit Margin (Excl OI)
12.66%
16.42%
-3.76%
Values in Rs Cr.
Direction Arrows
Net Sales

YoY Growth in year ended Mar 2026 is -0.37% vs 1.86% in Mar 2025

Direction Arrows
Standalone Net Profit

YoY Growth in year ended Mar 2026 is -21.46% vs -2.27% in Mar 2025

stock-summaryCompany CV
About Panchsheel Organics Ltd stock-summary
stock-summary
Panchsheel Organics Ltd
Micro Cap
Pharmaceuticals & Biotechnology
Incorporated as a private limited company in 1989, Panchsheel Organics Limited (POL) was later converted into a public limited company in 1992. Company is manufacturer and exporter of Active Pharma Ingredients (APIs), Intermediates & Finished Formulations (both Human & Veterinary), having a wide experience of more than three decades in the healthcare field.
Company Coordinates stock-summary
Company Details
B-6 & B-7 Sector - C, Industrial Estate Sanwer Road Indore Madhya Pradesh : 452015
stock-summary
Tel: 91-0731-22432 734
stock-summary
poltd@vsnl.com
Registrar Details
Purva Shareregistry (India) Pvt Ltd , Gala No 9, Shiv Shakti, Industrial Estate,Sitaram Mill Comp., J R Boricha Marg, Lower Parel [E], Mumbai