
Compare Panch.Organics with Similar Stocks
Stock DNA
Pharmaceuticals & Biotechnology
INR 157 Cr (Micro Cap)
14.00
27
2.06%
0.01
7.70%
1.09
Total Returns (Price + Dividend) 
Latest dividend: 0.8 per share ex-dividend date: Feb-20-2026
Risk Adjusted Returns v/s
Returns Beta

News
Are Panchsheel Organics Ltd latest results good or bad?
Panchsheel Organics Ltd's latest financial results for Q4 FY26 reveal a complex situation characterized by significant revenue growth juxtaposed with a sharp decline in profitability. The company reported net sales of ₹31.07 crores, marking a 16.24% increase quarter-on-quarter and a 9.52% rise year-on-year, which represents the highest quarterly revenue in its recent history. However, this revenue growth was overshadowed by a substantial drop in net profit, which fell to ₹1.70 crores, reflecting a 46.40% decrease from the previous quarter and a 46.37% decline year-on-year. The operating margin, a critical indicator of profitability, contracted to 7.82%, the lowest level in eight quarters, down from 14.14% in the prior quarter and significantly below the 16.81% achieved in Q4 FY25. This margin compression raises concerns about the company's ability to manage costs effectively amidst rising operational chall...
Read full news article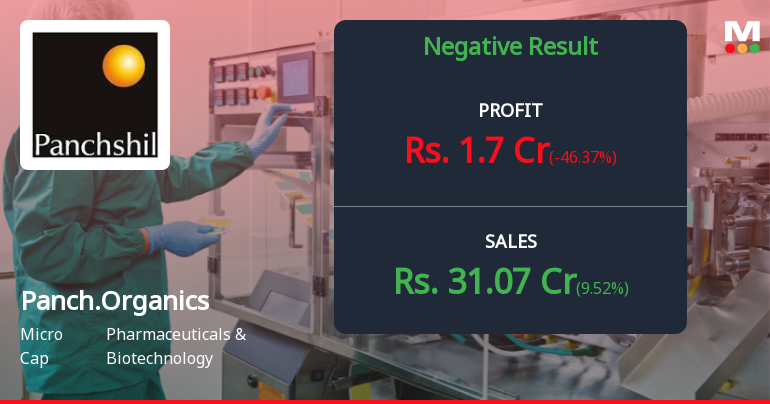
Panchsheel Organics Q4 FY26: Margin Collapse Overshadows Revenue Growth
Panchsheel Organics Ltd., an Indore-based active pharmaceutical ingredients (API) manufacturer, reported deeply concerning Q4 FY26 results that sent the stock tumbling 19.72% to ₹115.60 following the announcement. Whilst net sales reached a quarterly high of ₹31.07 crores—up 16.24% sequentially and 9.52% year-on-year—net profit collapsed 46.40% quarter-on-quarter to ₹1.70 crores, the lowest quarterly profit in over two years. The ₹172-crore market cap company faces mounting operational challenges despite maintaining modest top-line growth.
Read full news article
Panchsheel Organics Ltd Reports Sharp Decline in Profitability Despite Record Quarterly Sales
Panchsheel Organics Ltd, a micro-cap player in the Pharmaceuticals & Biotechnology sector, has reported a mixed quarterly performance for the period ending March 2026. While the company achieved its highest-ever quarterly net sales at ₹31.07 crores, key profitability metrics deteriorated sharply, signalling a negative financial trend reversal from the previous quarter.
Read full news article Announcements
Announcement under Regulation 30 (LODR)-Newspaper Publication
01-Jun-2026 | Source : BSEAnnouncement under Regulation-30(LODR)- Newspaper Publication of financial results of the Panchsheel Organics Limited for the quarter and year ended 31st March 2026 approved by the board in the meeting held on 30th May 2026.
Standalone And Audited Financial Results Of Panchsheel Organics Limited For The Quarter And Year Ended As On 31St March 2026
30-May-2026 | Source : BSEStandalone Audited financial results of Panchsheel Organics Limited for the quarter and year ended 31st March 2026
Standalone And Audited Financial Results Of Panchsheel Organics Limited For The Quarter And Year Ended As On 31St March 2026
30-May-2026 | Source : BSEStandalone Audited financial results of Panchsheel Organics Limited for the quarter and year ended 31st March 2026
Corporate Actions

No Upcoming Board Meetings

Panchsheel Organics Ltd has declared 8% dividend, ex-date: 12 Jun 26

No Splits history available

Panchsheel Organics Ltd has announced 1:1 bonus issue, ex-date: 06 Dec 21

No Rights history available
Quality key factors
Valuation key factors
Technicals key factors
 Technical Indicator Scale: Bearish, Mildly Bearish, Sideways, Mildly Bullish, Bullish Turned
 Shareholding Snapshot : Mar 2026
Shareholding Compare (%holding)
Promoters
None
Held by 0 Schemes
Held by 0 FIIs
Rajesh Abhaychand Turakhia (16.16%)
Michael Dsouza (1.94%)
33.42%
Quarterly Results Snapshot (Standalone) - Mar'26 - YoY

YoY Growth in quarter ended Mar 2026 is 9.52% vs -9.27% in Mar 2025

YoY Growth in quarter ended Mar 2026 is -46.37% vs 14.03% in Mar 2025
Half Yearly Results Snapshot (Standalone) - Sep'25
Growth in half year ended Sep 2025 is -8.19% vs 10.14% in Sep 2024
Growth in half year ended Sep 2025 is -24.41% vs 1.98% in Sep 2024
Nine Monthly Results Snapshot (Standalone) - Dec'25
YoY Growth in nine months ended Dec 2025 is -4.87% vs 7.48% in Dec 2024
YoY Growth in nine months ended Dec 2025 is -16.08% vs -3.97% in Dec 2024
Annual Results Snapshot (Standalone) - Mar'26
YoY Growth in year ended Mar 2026 is -0.37% vs 1.86% in Mar 2025
YoY Growth in year ended Mar 2026 is -21.46% vs -2.27% in Mar 2025
About Panchsheel Organics Ltd

Company Coordinates


