
Compare Pansari Develop. with Similar Stocks
Dashboard
Poor Management Efficiency with a low ROCE of 3.93%
- The company has been able to generate a Return on Capital Employed (avg) of 3.93% signifying low profitability per unit of total capital (equity and debt)
Low ability to service debt as the company has a high Debt to EBITDA ratio of 5.23 times
Flat results in Mar 26
With ROCE of 4.9, it has a Very Expensive valuation with a 2.9 Enterprise value to Capital Employed
Total Returns (Price + Dividend) 
Pansari Develop. for the last several years.
Risk Adjusted Returns v/s
Returns Beta

News

Pansari Developers Ltd is Rated Hold by MarketsMOJO
Pansari Developers Ltd is rated 'Hold' by MarketsMOJO, with this rating last updated on 17 June 2026. However, the analysis and financial metrics discussed here reflect the stock's current position as of 13 July 2026, providing investors with the latest insights into its performance and outlook.
Read full news article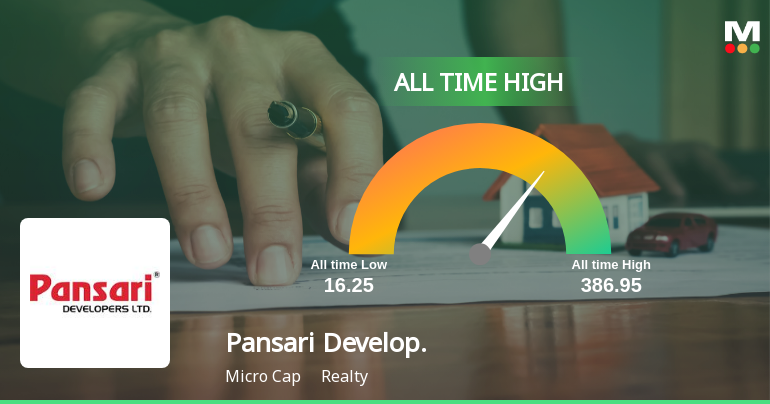
Pansari Developers Ltd Hits All-Time High as Momentum Accelerates Across Timeframes
Extending its remarkable rally, Pansari Developers Ltd surged 6.45% on 10 Jul 2026 to reach a fresh all-time high, outpacing the Sensex which gained a modest 0.96% on the same day. This milestone caps a sustained period of strong performance that has seen the stock nearly double in the past year, significantly outperforming its sector and benchmark indices.
Read full news article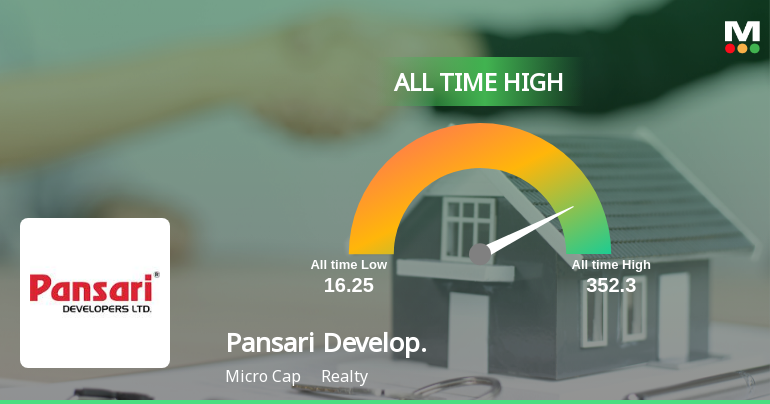
Announcements
Pansari Developers Limited - Reply to Clarification- Financial results
09-Dec-2019 | Source : NSEPansari Developers Limitedri Developers Limited for the quarter ended 30-Sep-2019 with respect to Regulation 33 of the SEBI (Listing Obligations and Disclosure Requirements) Regulations, 2015.
Pansari Developers Limited - Clarification - Financial Results
03-Dec-2019 | Source : NSEPansari Developers Limitedopers Limited for the quarter ended 30-Sep-2019 with respect to Regulation 33 of the SEBI (Listing Obligations and Disclosure Requirements) Regulations, 2015.
Pansari Developers Limited - Outcome of Board Meeting
15-Nov-2019 | Source : NSEPansari Developers Limited has informed the Exchange regarding Board meeting held on November 14, 2019.
Corporate Actions

No Upcoming Board Meetings

No Dividend history available

No Splits history available

No Bonus history available

No Rights history available
Quality key factors
Valuation key factors
Technicals key factors
 Technical Indicator Scale: Bearish, Mildly Bearish, Sideways, Mildly Bullish, Bullish Turned
 Shareholding Snapshot : Jun 2026
Shareholding Compare (%holding)
Promoters
None
Held by 0 Schemes
Held by 0 FIIs
Mahesh Agarwal (11.1%)
Rupak Trading Pvt Ltd (10.94%)
4.36%
Quarterly Results Snapshot (Consolidated) - Mar'26 - YoY

YoY Growth in quarter ended Mar 2026 is -27.30% vs 52.86% in Mar 2025
YoY Growth in quarter ended Mar 2026 is 53.06% vs 261.74% in Mar 2025
Half Yearly Results Snapshot (Standalone) - Sep'25
Not Applicable: The company has declared_date for only one period
Not Applicable: The company has declared_date for only one period
Nine Monthly Results Snapshot (Standalone) - Dec'25

YoY Growth in nine months ended Dec 2025 is 162.10% vs -28.21% in Dec 2024
YoY Growth in nine months ended Dec 2025 is 171.96% vs 15.05% in Dec 2024
Annual Results Snapshot (Consolidated) - Mar'26
YoY Growth in year ended Mar 2026 is 140.43% vs -29.24% in Mar 2025
YoY Growth in year ended Mar 2026 is 165.20% vs 43.95% in Mar 2025
About Pansari Developers Ltd

Company Coordinates


