
Compare Panth Infinity with Similar Stocks
Total Returns (Price + Dividend) 
Panth Infinity for the last several years.
Risk Adjusted Returns v/s
Returns Beta

News

Panth Infinity Ltd Downgraded to Sell Amid Mixed Technicals and Weak Financials
Panth Infinity Ltd, a micro-cap player in the diversified sector, has seen its investment rating downgraded from Hold to Sell as of 15 June 2026. This shift reflects a complex interplay of deteriorating technical indicators, flat financial performance, and valuation considerations, despite the company’s strong long-term returns and attractive price-to-book ratio.
Read full news article
Panth Infinity Ltd is Rated Hold
Panth Infinity Ltd is rated 'Hold' by MarketsMOJO, with this rating last updated on 19 May 2026. While the rating change occurred on that date, the analysis and financial metrics discussed here reflect the stock's current position as of 03 June 2026, providing investors with the most up-to-date perspective on the company’s performance and outlook.
Read full news article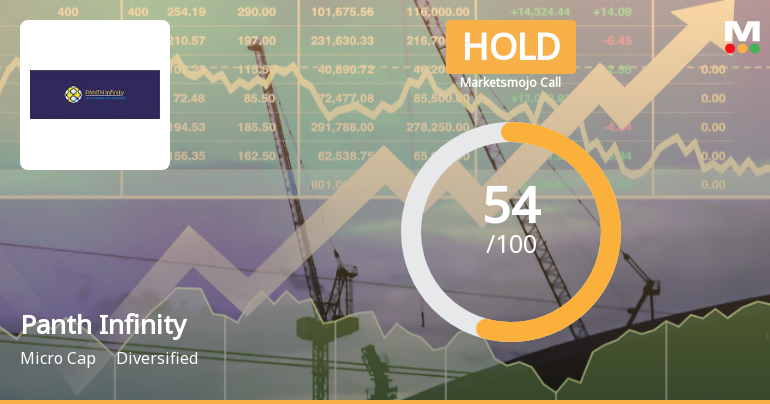
Panth Infinity Ltd Upgraded to Hold as Valuation Improves Despite Flat Financial Trend
Panth Infinity Ltd has seen its investment rating upgraded from Sell to Hold as of 19 May 2026, driven primarily by a very attractive valuation profile despite a flat financial trend in the latest quarter. The diversified sector micro-cap company’s Mojo Score rose to 54.0, reflecting a nuanced balance between valuation appeal and recent operational challenges.
Read full news article Announcements
Announcement under Regulation 30 (LODR)-Newspaper Publication
17-Jun-2026 | Source : BSESubmission of Newspaper Publication of Notice of Extra-Ordinary General Meeting
Notice Of Extra Ordinary General Meeting To Be Held On Tuesday July 07 2026.
15-Jun-2026 | Source : BSENotice of Extra Ordinary General Meeting to be held on Tuesday July 07 2026
Board Meeting Outcome for Shifting Of Registered Office Of The Company
12-Jun-2026 | Source : BSE1. Shifting of Registered Office from the State of Gujarat to the State of West Bengal subject to the approval of shareholders and Regional Director Ministry of Corporate Affairs.
Corporate Actions

No Upcoming Board Meetings

No Dividend history available

No Splits history available

Panth Infinity Ltd has announced 1:2 bonus issue, ex-date: 19 Jul 22

No Rights history available
Quality key factors
Valuation key factors
Technicals key factors
 Technical Indicator Scale: Bearish, Mildly Bearish, Sideways, Mildly Bullish, Bullish Turned
 Shareholding Snapshot : Mar 2026
Shareholding Compare (%holding)
Non Institution
None
Held by 0 Schemes
Held by 0 FIIs
None
Samyak Enterprise Private Limited (17.4%)
43.52%
Quarterly Results Snapshot (Standalone) - Mar'26 - QoQ

QoQ Growth in quarter ended Mar 2026 is -101.24% vs -91.68% in Dec 2025
QoQ Growth in quarter ended Mar 2026 is -363.71% vs -83.79% in Dec 2025
Half Yearly Results Snapshot (Standalone) - Sep'25

Growth in half year ended Sep 2025 is 10,749.09% vs -21.43% in Sep 2024
Growth in half year ended Sep 2025 is 6,825.00% vs 300.00% in Sep 2024
Nine Monthly Results Snapshot (Standalone) - Dec'25
YoY Growth in nine months ended Dec 2025 is 1,192.29% vs 213.35% in Dec 2024
YoY Growth in nine months ended Dec 2025 is 870.08% vs 735.00% in Dec 2024
Annual Results Snapshot (Standalone) - Mar'26
YoY Growth in year ended Mar 2026 is 537.20% vs 534.96% in Mar 2025
YoY Growth in year ended Mar 2026 is 555.80% vs 350.91% in Mar 2025
About Panth Infinity Ltd

Company Coordinates


