
Compare Panyam Cement with Similar Stocks
Dashboard
Weak Long Term Fundamental Strength as the company has not declared results in the last 6 months
- Poor long term growth as Net Sales has grown by an annual rate of 115.12% and Operating profit at 0% over the last 5 years
- The company has a negative book value of Rs 227.31 crore
Flat results in Dec 25
Risky - Negative EBITDA
Below par performance in long term as well as near term
Stock DNA
Cement & Cement Products
INR 79 Cr (Micro Cap)
NA (Loss Making)
34
0.00%
-1.73
39.25%
-0.35
Total Returns (Price + Dividend) 
Panyam Cement for the last several years.
Risk Adjusted Returns v/s
Returns Beta

News

Panyam Cements & Mineral Industries Ltd is Rated Strong Sell
Panyam Cements & Mineral Industries Ltd is rated Strong Sell by MarketsMOJO. This rating was last updated on 28 July 2025, reflecting a shift from the previous 'Sell' grade. However, the analysis and financial metrics discussed here represent the stock's current position as of 09 July 2026, providing investors with an up-to-date view of the company’s performance and outlook.
Read full news article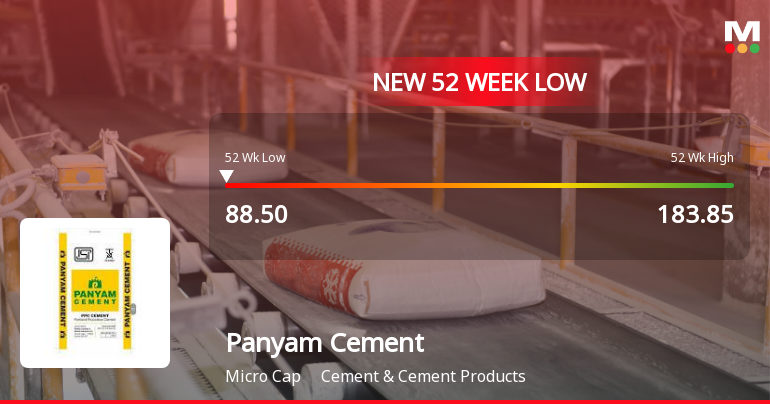
Panyam Cements & Mineral Industries Ltd Falls to 52-Week Low of Rs 88.5 as Sell-Off Deepens
A sharp decline of 4.38% today dragged Panyam Cements & Mineral Industries Ltd to a fresh 52-week low of Rs 88.5, marking a near 48% drop from its peak price of Rs 183.85 over the past year. This underperformance stands in stark contrast to the broader market, where the Sensex gained 0.66% and several sectoral indices hit new highs.
Read full news article
Panyam Cements & Mineral Industries Ltd is Rated Strong Sell
Panyam Cements & Mineral Industries Ltd is rated Strong Sell by MarketsMOJO. This rating was last updated on 28 July 2025, reflecting a reassessment of the company’s outlook. However, the analysis and financial metrics presented here are based on the stock’s current position as of 28 June 2026, providing investors with the latest insights into its performance and prospects.
Read full news article Announcements
Compliances-Certificate under Reg. 74 (5) of SEBI (DP) Regulations 2018
03-Jul-2026 | Source : BSEIn terms of the above-stated subject we hereby submit herewith the certificate dated 02nd July 2026 issued by XL Softech Systems Limited Register and share transfer agent of the Company confirming compliance with the said regulation for the Quarter ended 30th June 2026
Closure of Trading Window
29-Jun-2026 | Source : BSEWe wish to inform you that Pursuant to the provisions of SEBI (Prohibition of Insider Trading) Regulations 2015 the Trading window for dealing in the securities of the company shall remain closed with effect from 1st july 2026 till the expiry of 48 hours from the post declaration of the unaudited financial results of the company for the first quarter of 30th June 2026
Results-Delay in Financial Results
27-May-2026 | Source : BSEpursuant to regulation 33 of SEBI (LODR) 2015
Corporate Actions

No Upcoming Board Meetings

No Dividend history available

Panyam Cements & Mineral Industries Ltd has announced 10:100 stock split, ex-date: 13 Sep 06

No Bonus history available

No Rights history available
Quality key factors
Valuation key factors
Technicals key factors
 Technical Indicator Scale: Bearish, Mildly Bearish, Sideways, Mildly Bullish, Bullish Turned
 Shareholding Snapshot : Jun 2026
Shareholding Compare (%holding)
Promoters
None
Held by 2 Schemes (0.0%)
Held by 0 FIIs
J Srinisha (90.0%)
None
4.22%
Quarterly Results Snapshot (Standalone) - Dec'25 - QoQ

QoQ Growth in quarter ended Dec 2025 is -11.92% vs 7,760.00% in Sep 2025
QoQ Growth in quarter ended Dec 2025 is -21.39% vs 11.91% in Sep 2025
Half Yearly Results Snapshot (Standalone) - Sep'25
Growth in half year ended Sep 2025 is -61.55% vs 80.27% in Sep 2024

Growth in half year ended Sep 2025 is 7.06% vs -57.00% in Sep 2024
Nine Monthly Results Snapshot (Standalone) - Dec'25
YoY Growth in nine months ended Dec 2025 is -46.26% vs 2.86% in Dec 2024
YoY Growth in nine months ended Dec 2025 is 3.10% vs -45.48% in Dec 2024
Annual Results Snapshot (Standalone) - Mar'25
YoY Growth in year ended Mar 2025 is -30.47% vs 209.11% in Mar 2024
YoY Growth in year ended Mar 2025 is -62.10% vs 8.07% in Mar 2024
About Panyam Cements & Mineral Industries Ltd

Company Coordinates


