
Compare Par Pacific Holdings, Inc. with Similar Stocks
Dashboard
Healthy long term growth as Net Sales has grown by an annual rate of 10.99% and Operating profit at -205.50%
With a growth in Operating Profit of 547.08%, the company declared Very Positive results in Jun 25
With ROCE of -1.65%, it has a risky valuation with a 1.00 Enterprise value to Capital Employed
Market Beating performance in long term as well as near term
Total Returns (Price + Dividend) 
Par Pacific Holdings, Inc. for the last several years.
Risk Adjusted Returns v/s
News
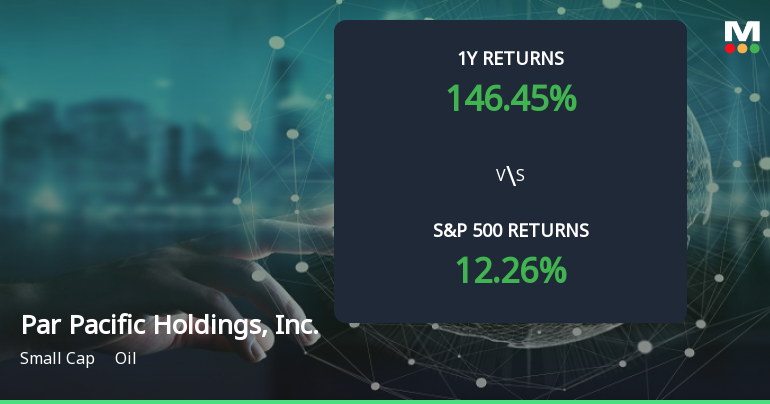
Par Pacific Holdings Achieves 146.45% Annual Gain, Establishing It as a Multibagger Stock
Par Pacific Holdings, Inc. has recently experienced a revision in its score, reflecting the company's impressive stock performance despite ongoing challenges. With a notable increase in stock value over the past year, the company remains a focal point for investors, balancing strong growth metrics against a backdrop of financial difficulties.
Read full news article Announcements

Corporate Actions
Quality key factors
Valuation key factors
Technicals key factors
 Technical Indicator Scale: Bearish, Mildly Bearish, Sideways, Mildly Bullish, Bullish Turned
 Shareholding Snapshot : Sep 2025
Shareholding Compare (%holding)
Domestic Funds
Held in 77 Schemes (44.22%)
Held by 114 Foreign Institutions (8.85%)
Quarterly Results Snapshot (Consolidated) - Jun'25 - QoQ

QoQ Growth in quarter ended Jun 2025 is 8.50% vs -4.76% in Mar 2025
QoQ Growth in quarter ended Jun 2025 is 295.72% vs 45.42% in Mar 2025
Annual Results Snapshot (Consolidated) - Dec'24

YoY Growth in year ended Dec 2024 is -3.13% vs 12.43% in Dec 2023
YoY Growth in year ended Dec 2024 is -104.57% vs 100.05% in Dec 2023
About Par Pacific Holdings, Inc.

Company Coordinates


