
Compare Paradeep Phosph. with Similar Stocks
Dashboard
Healthy long term growth as Net Sales has grown by an annual rate of 27.13% and Operating profit at 31.44%
- NET SALES(Latest six months) At Rs 10,826.22 cr has Grown at 24.48%
- PBDIT(Q) Highest at Rs 720.23 cr.
- PBT LESS OI(Q) Highest at Rs 482.79 cr.
With ROCE of 13.2, it has a Attractive valuation with a 1.7 Enterprise value to Capital Employed
High Institutional Holdings at 23.28%
Stock DNA
Fertilizers
INR 15,900 Cr (Small Cap)
15.00
24
0.50%
0.96
15.14%
2.40
Total Returns (Price + Dividend) 
Latest dividend: 1 per share ex-dividend date: Aug-22-2025
Risk Adjusted Returns v/s
Returns Beta

News
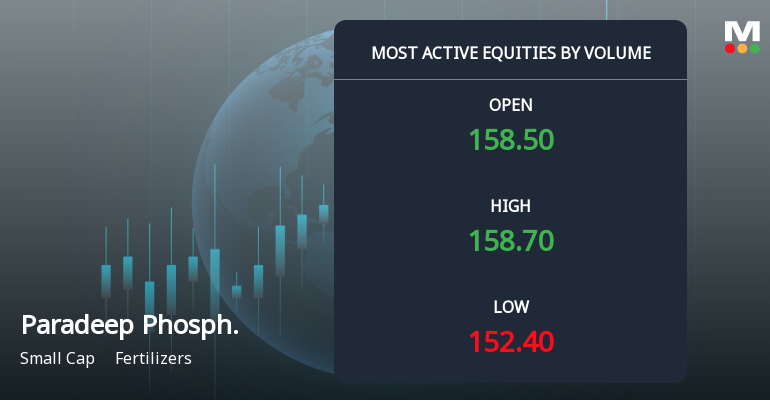
Paradeep Phosphates Sees Exceptional Volume Amid Price Correction
Paradeep Phosphates Ltd (symbol: PARADEEP) emerged as one of the most actively traded stocks on 30 July 2026, registering a remarkable volume surge despite a modest decline in its share price. The stock’s trading activity highlights significant investor interest and potential accumulation signals amid a volatile market backdrop.
Read full news article
Paradeep Phosphates Q1 FY27: Stellar Performance Driven by Volume Growth and Margin Expansion
Paradeep Phosphates Ltd., a leading Indian fertilizer manufacturer, delivered an exceptional first quarter performance for FY27, with consolidated net profit surging 152.28% quarter-on-quarter to ₹392.54 crores, marking the highest quarterly profit in the company's recent history. The stock responded with enthusiasm, rallying 12.60% to ₹156.80 on July 29, 2026, as investors welcomed the robust operational performance underpinned by strong volume growth and impressive margin expansion.
Read full news article
Paradeep Phosphates Ltd Reports Strong Quarterly Turnaround Amid Market Volatility
Paradeep Phosphates Ltd has demonstrated a notable financial turnaround in the quarter ended June 2026, reversing a negative trend to post robust revenue growth and margin expansion. This shift has been reflected in an improved Mojo Grade, signalling renewed investor interest despite broader market challenges.
Read full news article Announcements
Formulation Of Paradeep Phosphates Limited Performance Stock Option Plan 2026 (PSOP 2026)
28-Jul-2026 | Source : BSEDisclosure under regulation 30 of SEBI (LODR) Regulations 2015
Approval For Setting Up An Aluminium Fluoride (Alf3) Manufacturing Plant At Paradeep
28-Jul-2026 | Source : BSEDisclosure under regulation 30 of SEBI (LODR) Regulations 2015
Unaudited Standalone And Consolidated Financial Results Of The Company For The Quarter Ended June 30 2026
28-Jul-2026 | Source : BSEOutcome of Board Meeting
Corporate Actions

No Upcoming Board Meetings

Paradeep Phosphates Ltd has declared 10% dividend, ex-date: 22 Aug 25

No Splits history available

No Bonus history available

No Rights history available
Quality key factors
Valuation key factors
Technicals key factors
 Technical Indicator Scale: Bearish, Mildly Bearish, Sideways, Mildly Bullish, Bullish Turned
 Shareholding Snapshot : Jun 2026
Shareholding Compare (%holding)
Promoters
15.3287
Held by 21 Schemes (17.83%)
Held by 126 FIIs (5.1%)
Zuari Maroc Phosphates Private Limited (50.31%)
Sbi Multicap Fund (4%)
15.32%
Quarterly Results Snapshot (Consolidated) - Jun'26 - QoQ

QoQ Growth in quarter ended Jun 2026 is 30.25% vs -18.21% in Mar 2026
QoQ Growth in quarter ended Jun 2026 is 152.28% vs -14.53% in Mar 2026
Half Yearly Results Snapshot (Consolidated) - Sep'25
Growth in half year ended Sep 2025 is 46.31% vs 15.40% in Sep 2024

Growth in half year ended Sep 2025 is 134.74% vs 1,019.70% in Sep 2024
Nine Monthly Results Snapshot (Consolidated) - Dec'25
YoY Growth in nine months ended Dec 2025 is 34.15% vs 36.78% in Dec 2024
YoY Growth in nine months ended Dec 2025 is 71.60% vs 524.84% in Dec 2024
Annual Results Snapshot (Consolidated) - Mar'26
YoY Growth in year ended Mar 2026 is 28.70% vs 46.51% in Mar 2025
YoY Growth in year ended Mar 2026 is 50.48% vs 562.73% in Mar 2025
About Paradeep Phosphates Ltd

Company Coordinates


