
Compare Paramount Comm. with Similar Stocks
Dashboard
Healthy long term growth as Net Sales has grown by an annual rate of 29.81% and Operating profit at 46.83%
The company has declared Negative results for the last 3 consecutive quarters
With ROCE of 5.9, it has a Fair valuation with a 2.5 Enterprise value to Capital Employed
Market Beating performance in long term as well as near term
Stock DNA
Cables - Electricals
INR 2,086 Cr (Micro Cap)
36.00
45
0.00%
0.12
7.68%
2.71
Total Returns (Price + Dividend) 
Latest dividend: 0.4 per share ex-dividend date: Sep-11-2008
Risk Adjusted Returns v/s
Returns Beta

News

Paramount Communications Ltd is Rated Hold
Paramount Communications Ltd is rated Hold by MarketsMOJO, with this rating last updated on 08 June 2026. However, the analysis and financial metrics discussed here reflect the stock’s current position as of 12 July 2026, providing investors with the latest insights into the company’s performance and outlook.
Read full news article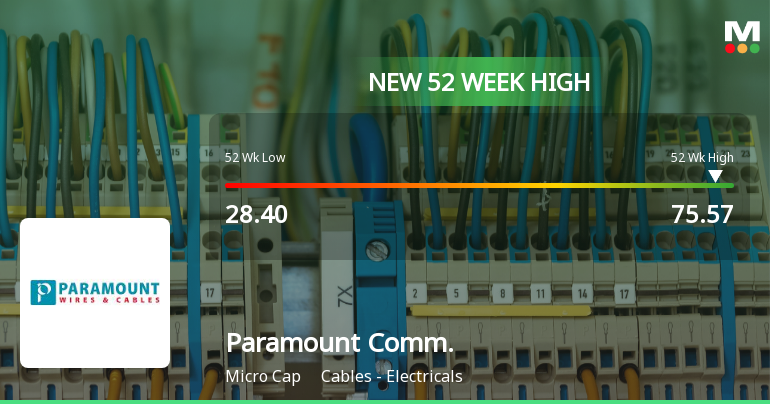
Broad-Based Technical Strength Lifts Paramount Communications Ltd to 52-Week High of Rs 75.57
With a decisive breakthrough to Rs 75.57 on 2 Jul 2026, Paramount Communications Ltd has reached a fresh 52-week high, marking a significant milestone in its price momentum. This surge comes amid a backdrop of strong technical signals across multiple timeframes, underscoring the stock’s robust upward trajectory despite a slight underperformance in today’s session.
Read full news article
Paramount Communications Ltd is Rated Hold
Paramount Communications Ltd is rated Hold by MarketsMOJO, with this rating last updated on 08 June 2026. While the rating change occurred on that date, the analysis and financial metrics discussed here reflect the stock’s current position as of 01 July 2026, providing investors with the most up-to-date insight into the company’s performance and outlook.
Read full news article Announcements
Disclosure Under Regulation 30
14-Jul-2026 | Source : BSEIntimation for Allotment of Equity Shares againts exersice of vested Employee Stock Option under Paramount Communications Limited -Stock Incentive Plan 2023
Announcement under Regulation 30 (LODR)-Credit Rating
14-Jul-2026 | Source : BSEIntimation of Credit Rating(s) pursunat to Regulation 30 of SEBI (LODR) Regulation2015.
Compliances-Certificate under Reg. 74 (5) of SEBI (DP) Regulations 2018
10-Jul-2026 | Source : BSEDisclosure in pursuant to Regulation 74(5) of SEBI (DP) Regulation 2018
Corporate Actions

No Upcoming Board Meetings

Paramount Communications Ltd has declared 20% dividend, ex-date: 11 Sep 08

Paramount Communications Ltd has announced 2:10 stock split, ex-date: 25 Jan 07

No Bonus history available

No Rights history available
Quality key factors
Valuation key factors
Technicals key factors
 Technical Indicator Scale: Bearish, Mildly Bearish, Sideways, Mildly Bullish, Bullish Turned
 Shareholding Snapshot : Jul 2026
Shareholding Compare (%holding)
Non Institution
None
Held by 0 Schemes
Held by 29 FIIs (0.45%)
Hertz Electricals (international) Pvt. Ltd. (14.21%)
Enforcement Directorate Raipur (1.58%)
36.84%
Quarterly Results Snapshot (Consolidated) - Mar'26 - YoY

YoY Growth in quarter ended Mar 2026 is 13.07% vs 56.79% in Mar 2025

YoY Growth in quarter ended Mar 2026 is 9.50% vs -36.45% in Mar 2025
Half Yearly Results Snapshot (Consolidated) - Sep'25
Growth in half year ended Sep 2025 is 29.86% vs 46.22% in Sep 2024
Growth in half year ended Sep 2025 is -30.42% vs 34.13% in Sep 2024
Nine Monthly Results Snapshot (Consolidated) - Dec'25
YoY Growth in nine months ended Dec 2025 is 25.40% vs 43.01% in Dec 2024
YoY Growth in nine months ended Dec 2025 is -42.50% vs 21.73% in Dec 2024
Annual Results Snapshot (Consolidated) - Mar'26
YoY Growth in year ended Mar 2026 is 21.44% vs 47.17% in Mar 2025
YoY Growth in year ended Mar 2026 is -31.30% vs 1.56% in Mar 2025
About Paramount Communications Ltd

Company Coordinates


