
Compare Paramount Comm. with Similar Stocks
Dashboard
Healthy long term growth as Net Sales has grown by an annual rate of 30.48% and Operating profit at 37.20%
The company has declared Negative results for the last 3 consecutive quarters
With ROE of 9.8, it has a Attractive valuation with a 2.4 Price to Book Value
Despite the size of the company, domestic mutual funds hold only 0% of the company
Market Beating performance in long term as well as near term
Stock DNA
Cables - Electricals
INR 1,995 Cr (Micro Cap)
31.00
47
0.00%
0.10
9.75%
2.42
Total Returns (Price + Dividend) 
Latest dividend: 0.4 per share ex-dividend date: Sep-11-2008
Risk Adjusted Returns v/s
Returns Beta

News

Paramount Communications Ltd Locks at Upper Circuit With 10% Gain — Buyers Queue, Sellers Absent
At Rs 65.35, the buying was done — not because demand dried up, but because the exchange wouldn't let the stock go any higher. Paramount Communications Ltd locked at its upper circuit of 10% on 25 May 2026, with buyers queuing and no sellers willing to part with shares.
Read full news article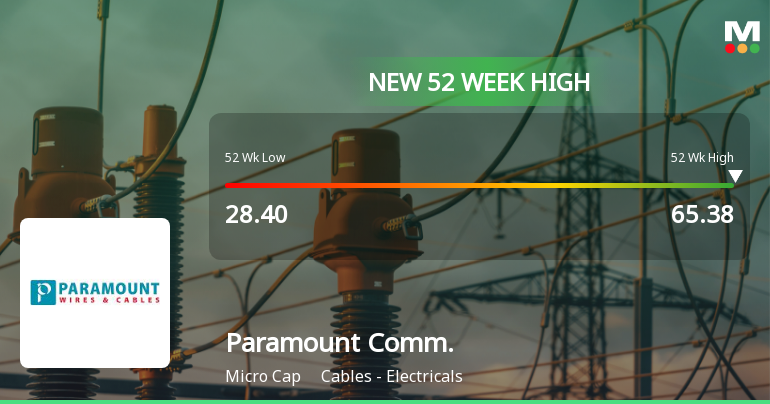
Broad-Based Technical Strength Lifts Paramount Communications Ltd to 52-Week High of Rs 65.38
With a decisive intraday surge to Rs 65.38 on 25 Jun 2026, Paramount Communications Ltd has reached a fresh 52-week high, marking a significant milestone in its price momentum. This rally comes amid a sustained four-day gain that has propelled the stock up by nearly 20%, outpacing its sector and the broader market.
Read full news article
Paramount Communications Ltd Upgraded to Hold on Technical and Valuation Improvements
Paramount Communications Ltd, a micro-cap player in the Cables - Electricals sector, has seen its investment rating upgraded from Sell to Hold as of 23 May 2026. This change reflects a nuanced reassessment across four key parameters: quality, valuation, financial trend, and technicals. Despite recent quarterly setbacks, the stock’s improved technical indicators and attractive valuation metrics have prompted a more cautious but optimistic stance among analysts.
Read full news article Announcements
Board Meeting Outcome for Outcome Of Board Meeting
22-May-2026 | Source : BSEOutcome of Board Meeting pursuant to Regulation 30 and 33 of SEBI ( Listing Obligations and Disclosure Requirements)Regulations 2015
Results For The Quarter And Year Ended 31.03.2026
22-May-2026 | Source : BSEAudited Financial Results for the quarter and year ended March 31 2026
Announcement under Regulation 30 (LODR)-Change in Management
22-May-2026 | Source : BSEAnnouncement under Regulation 30 of SEBI ( Listing Obligations and Disclosure Reqiurements) Regulations 2015- Re-Appointment of Cost Auditors and Internal Auditors for the Financial year 2026-2027
Corporate Actions

No Upcoming Board Meetings

Paramount Communications Ltd has declared 20% dividend, ex-date: 11 Sep 08

Paramount Communications Ltd has announced 2:10 stock split, ex-date: 25 Jan 07

No Bonus history available

No Rights history available
Quality key factors
Valuation key factors
Technicals key factors
 Technical Indicator Scale: Bearish, Mildly Bearish, Sideways, Mildly Bullish, Bullish Turned
 Shareholding Snapshot : Mar 2026
Shareholding Compare (%holding)
Promoters
None
Held by 0 Schemes
Held by 23 FIIs (0.51%)
Hertz Electricals (international) Pvt. Ltd. (15.23%)
Central Government (1.7%)
40.78%
Quarterly Results Snapshot (Consolidated) - Mar'26 - YoY

YoY Growth in quarter ended Mar 2026 is 13.07% vs 56.79% in Mar 2025

YoY Growth in quarter ended Mar 2026 is 9.50% vs -36.45% in Mar 2025
Half Yearly Results Snapshot (Consolidated) - Sep'25
Growth in half year ended Sep 2025 is 29.86% vs 46.22% in Sep 2024
Growth in half year ended Sep 2025 is -30.42% vs 34.13% in Sep 2024
Nine Monthly Results Snapshot (Consolidated) - Dec'25
YoY Growth in nine months ended Dec 2025 is 25.40% vs 43.01% in Dec 2024
YoY Growth in nine months ended Dec 2025 is -42.50% vs 21.73% in Dec 2024
Annual Results Snapshot (Consolidated) - Mar'26
YoY Growth in year ended Mar 2026 is 21.44% vs 47.17% in Mar 2025
YoY Growth in year ended Mar 2026 is -31.30% vs 1.56% in Mar 2025
About Paramount Communications Ltd

Company Coordinates


