
Compare Paramount Cosmet with Similar Stocks
Dashboard
Weak Long Term Fundamental Strength with a -7.13% CAGR growth in Operating Profits over the last 5 years
- Company's ability to service its debt is weak with a poor EBIT to Interest (avg) ratio of 0.20
- The company has been able to generate a Return on Equity (avg) of 0.52% signifying low profitability per unit of shareholders funds
Flat results in Mar 26
With ROE of 0.2, it has a Expensive valuation with a 0.8 Price to Book Value
Below par performance in long term as well as near term
Total Returns (Price + Dividend) 
Latest dividend: 0.5 per share ex-dividend date: Sep-21-2017
Risk Adjusted Returns v/s
Returns Beta

News
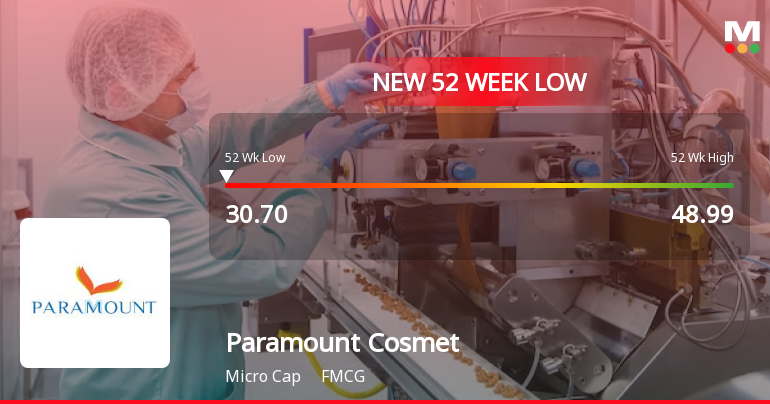
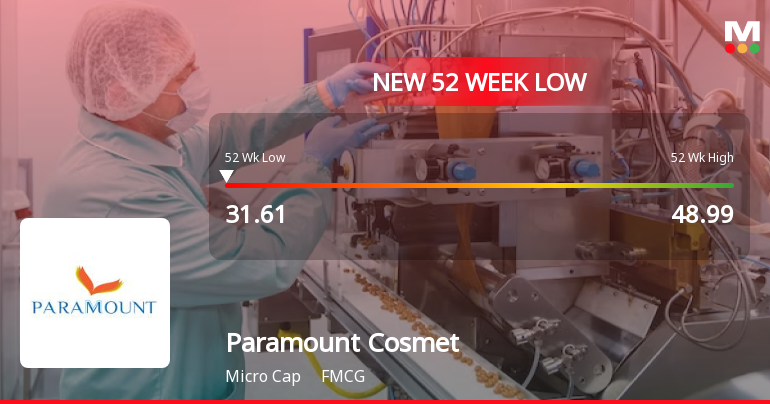
Paramount Cosmetics Falls to 52-Week Low of Rs 31.61 as Sell-Off Deepens
A sharp 7.08% decline today dragged Paramount Cosmetics (India) Ltd to a fresh 52-week low of Rs 31.61, extending its underperformance amid a volatile trading session and persistent downward pressure.
Read full news article
Paramount Cosmetics Falls to 52-Week Low of Rs 32.55 as Sell-Off Deepens
For the second consecutive session, Paramount Cosmetics (India) Ltd has succumbed to selling pressure, hitting a fresh 52-week low of Rs 32.55 on 8 Jun 2026. This decline comes amid a broader market backdrop where the Sensex itself is struggling, but the stock’s underperformance is notably sharper and more sustained.
Read full news article Announcements
Compliances-Certificate under Reg. 74 (5) of SEBI (DP) Regulations 2018
14-Jul-2026 | Source : BSESubmission of Compliance certificate under Regulation 74(5) of SEBI (DP) Regulations 2018 for the quarter ended 30.06.2026.
Closure of Trading Window
25-Jun-2026 | Source : BSEIntimation of Closure of Trading Window for the Quarter ended 30.06.2026.
Change In Official E-Mail ID Of The Company.
23-Jun-2026 | Source : BSEPursuant to Regulation 30 of SEBI (LODR) Regulations 2015 we hereby inform that the official email ID of the Company has been changed with the effective from 23.06.2026. The details of the change are as under . Old Email ID: compliance.officer@parammount.com New Email ID: compliance@parcos.in All Shareholders investors and stakeholders are requested to use the new email ID for future correspondence with the Company.
Corporate Actions

No Upcoming Board Meetings

Paramount Cosmetics (India) Ltd has declared 5% dividend, ex-date: 21 Sep 17

No Splits history available

No Bonus history available

No Rights history available
Quality key factors
Valuation key factors
Technicals key factors
 Technical Indicator Scale: Bearish, Mildly Bearish, Sideways, Mildly Bullish, Bullish Turned
 Shareholding Snapshot : Jun 2026
Shareholding Compare (%holding)
Promoters
None
Held by 0 Schemes
Held by 0 FIIs
Hiitesh Topiiwaalla (52.79%)
None
20.07%
Quarterly Results Snapshot (Standalone) - Mar'26 - QoQ

QoQ Growth in quarter ended Mar 2026 is -46.65% vs -39.82% in Dec 2025
QoQ Growth in quarter ended Mar 2026 is -266.67% vs -76.92% in Dec 2025
Half Yearly Results Snapshot (Standalone) - Sep'25

Growth in half year ended Sep 2025 is 51.07% vs -15.15% in Sep 2024
Growth in half year ended Sep 2025 is 133.33% vs -85.00% in Sep 2024
Nine Monthly Results Snapshot (Standalone) - Dec'25
YoY Growth in nine months ended Dec 2025 is 29.08% vs -13.76% in Dec 2024
YoY Growth in nine months ended Dec 2025 is 100.00% vs -78.26% in Dec 2024
Annual Results Snapshot (Standalone) - Mar'26
YoY Growth in year ended Mar 2026 is 4.96% vs -6.56% in Mar 2025
YoY Growth in year ended Mar 2026 is 66.67% vs 50.00% in Mar 2025
About Paramount Cosmetics (India) Ltd

Company Coordinates


