
Compare Paras Defence with Similar Stocks
Stock DNA
Aerospace & Defense
INR 9,669 Cr (Small Cap)
112.00
NA
0.00%
-0.13
11.82%
13.19
Total Returns (Price + Dividend) 
Latest dividend: 0.25 per share ex-dividend date: Aug-08-2025
Risk Adjusted Returns v/s
Returns Beta

News

Paras Defence and Space Technologies Ltd is Rated Buy
Paras Defence and Space Technologies Ltd is rated Buy by MarketsMOJO, with this rating last updated on 05 June 2026. However, the analysis and financial metrics discussed here reflect the stock's current position as of 22 July 2026, providing investors with an up-to-date view of the company’s fundamentals, returns, and market performance.
Read full news article
Paras Defence and Space Technologies Ltd is Rated Buy
Paras Defence and Space Technologies Ltd is rated 'Buy' by MarketsMOJO, with this rating last updated on 5 June 2026. However, the analysis and financial metrics discussed here reflect the stock's current position as of 11 July 2026, providing investors with the latest insights into its performance and outlook.
Read full news article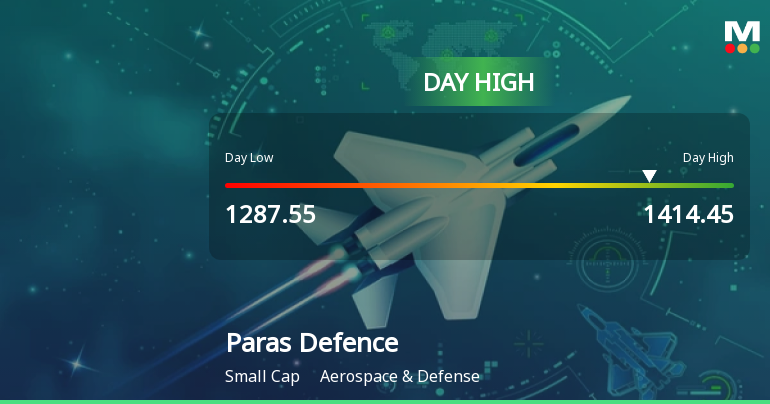
Paras Defence and Space Technologies Ltd Surges 8.22% to Day's High of Rs 1414.1 — Outperforms Sector by 7.7 Percentage Points
The Sensex advanced 0.64% on 6 Jul 2026, yet Paras Defence and Space Technologies Ltd outpaced the broader market with an 8.22% gain, touching an intraday high of Rs 1414.1. This 7.7 percentage-point outperformance over the Aerospace & Defense sector highlights a distinctly stock-specific rally rather than a market-wide lift.
Read full news article Announcements
Announcement under Regulation 30 (LODR)-Change in Management
24-Jul-2026 | Source : BSEIntimation under Regulation 30 of SEBI (Listing Obligations and Disclosure Requirements) Regulations 2015 - Appointment of Senior Management Personnel.
Amendment To Code For Prohibition Of Insider Trading And Fair Disclosure Of Unpublished Price Sensitive Information (UPSI) Of The Company Under SEBI (Prohibition Of Insider Trading) Regulations 2015
24-Jul-2026 | Source : BSEAmendment to Code for Prohibition of Insider Trading and Fair Disclosure of Unpublished Price Sensitive Information (UPSI) of the Company under SEBI (Prohibition of Insider Trading) Regulations 2015
Announcement under Regulation 30 (LODR)-Memorandum of Understanding /Agreements
22-Jul-2026 | Source : BSEIntimation under Regulation 30 of SEBI (Listing Obligations and Disclosure Requirements) Regulations 2015 - Signing of Memoradum of Understanding (MoU) with MP State Electronics Development Corporation (MPSeDC)
Corporate Actions

No Upcoming Board Meetings

Paras Defence and Space Technologies Ltd has declared 5% dividend, ex-date: 08 Aug 25

Paras Defence and Space Technologies Ltd has announced 5:10 stock split, ex-date: 04 Jul 25

No Bonus history available

No Rights history available
Quality key factors
Valuation key factors
Technicals key factors
 Technical Indicator Scale: Bearish, Mildly Bearish, Sideways, Mildly Bullish, Bullish Turned
 Shareholding Snapshot : Jun 2026
Shareholding Compare (%holding)
Promoters
None
Held by 10 Schemes (2.98%)
Held by 64 FIIs (8.29%)
Munjal Sharad Shah (24.47%)
Abu Dhabi Investment Authority - Monsoon (2.4%)
29.08%
Quarterly Results Snapshot (Consolidated) - Mar'26 - QoQ

QoQ Growth in quarter ended Mar 2026 is 61.08% vs 0.60% in Dec 2025
QoQ Growth in quarter ended Mar 2026 is 88.80% vs -11.77% in Dec 2025
Half Yearly Results Snapshot (Consolidated) - Sep'25

Growth in half year ended Sep 2025 is 16.55% vs 55.67% in Sep 2024
Growth in half year ended Sep 2025 is 23.69% vs 86.07% in Sep 2024
Nine Monthly Results Snapshot (Consolidated) - Dec'25
YoY Growth in nine months ended Dec 2025 is 19.04% vs 47.53% in Dec 2024
YoY Growth in nine months ended Dec 2025 is 22.79% vs 98.05% in Dec 2024
Annual Results Snapshot (Consolidated) - Mar'26
YoY Growth in year ended Mar 2026 is 30.69% vs 43.85% in Mar 2025
YoY Growth in year ended Mar 2026 is 38.81% vs 97.97% in Mar 2025
About Paras Defence and Space Technologies Ltd

Company Coordinates


