
Compare Parker Agrochem with Similar Stocks
Stock DNA
Trading & Distributors
INR 8 Cr (Micro Cap)
9.00
21
0.00%
-0.03
18.39%
1.65
Total Returns (Price + Dividend) 
Parker Agrochem for the last several years.
Risk Adjusted Returns v/s
Returns Beta

News
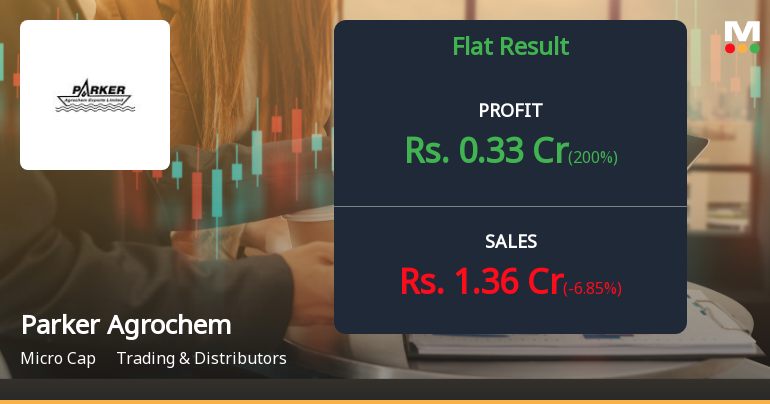
Parker Agrochem Q4 FY26: Margin Recovery Amid Revenue Volatility
Parker Agrochem Exports Ltd., a micro-cap trading and distribution company with a market capitalisation of ₹7.80 crores, reported a net profit of ₹0.33 crores for Q4 FY26, marking a sharp 200.00% sequential improvement from Q3 FY26's ₹0.11 crores but a 120.00% surge over the prior year's Q4 FY25 profit of ₹0.15 crores. The results reveal a company navigating extreme revenue volatility whilst demonstrating resilience in margin management.
Read full news article
Parker Agrochem Exports Ltd Upgraded to Sell on Improved Technicals and Valuation
Parker Agrochem Exports Ltd has seen its investment rating upgraded from Strong Sell to Sell, reflecting a nuanced improvement across technical indicators and valuation metrics despite flat recent financial performance. This recalibration follows a detailed analysis of quality, valuation, financial trends, and technicals, signalling a cautious but more optimistic outlook for this micro-cap player in the Trading & Distributors sector.
Read full news article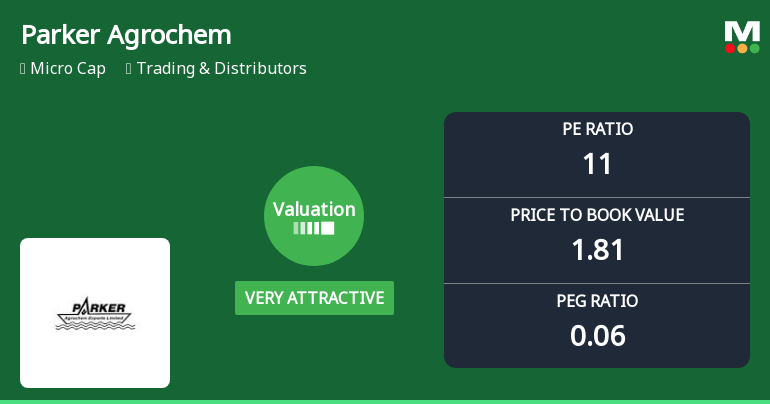
Parker Agrochem Exports Ltd Valuation Shifts Signal Enhanced Price Attractiveness
Parker Agrochem Exports Ltd has witnessed a notable shift in its valuation parameters, moving from an attractive to a very attractive price level. This change is underscored by a decline in its price-to-earnings (P/E) and price-to-book value (P/BV) ratios relative to historical averages and peer comparisons, signalling a potential opportunity for investors despite a challenging year-to-date performance.
Read full news article Announcements
Submission Of Audited Financial Results For The Quarter And Year Ended On 31St March 2026
28-May-2026 | Source : BSEAudited Financial Results for the quarter and year ended on 31-03-2026
Non Applicability Of Regulation 24A
18-May-2026 | Source : BSENon Applicability of Regulation 24A for the year ended on 31-03-2026
Board Meeting Intimation for Taking On Record Audited Financial Results For The Quarter And Year Ended On 31St March 2026
12-May-2026 | Source : BSEParker Agrochem Exports Ltd-has informed BSE that the meeting of the Board of Directors of the Company is scheduled on 28/05/2026 inter alia to consider and approve the Audited Financial Results for the quarter and year ended on 31st March 2026
Corporate Actions

No Upcoming Board Meetings

No Dividend history available

No Splits history available

No Bonus history available

No Rights history available
Quality key factors
Valuation key factors
Technicals key factors
 Technical Indicator Scale: Bearish, Mildly Bearish, Sideways, Mildly Bullish, Bullish Turned
 Shareholding Snapshot : Mar 2026
Shareholding Compare (%holding)
Promoters
None
Held by 0 Schemes
Held by 0 FIIs
Jagdishbhai R Acharya (54.23%)
Kunvarji Finstock Private Limited (2.73%)
34.01%
Quarterly Results Snapshot (Standalone) - Mar'26 - QoQ

QoQ Growth in quarter ended Mar 2026 is -6.85% vs -3.31% in Dec 2025

QoQ Growth in quarter ended Mar 2026 is 200.00% vs -76.60% in Dec 2025
Half Yearly Results Snapshot (Standalone) - Sep'25
Growth in half year ended Sep 2025 is 76.06% vs -55.06% in Sep 2024
Growth in half year ended Sep 2025 is 202.44% vs -131.30% in Sep 2024
Nine Monthly Results Snapshot (Standalone) - Dec'25
YoY Growth in nine months ended Dec 2025 is -92.79% vs 1,050.94% in Dec 2024
YoY Growth in nine months ended Dec 2025 is 251.43% vs -125.00% in Dec 2024
Annual Results Snapshot (Standalone) - Mar'26
YoY Growth in year ended Mar 2026 is -91.97% vs 1,113.55% in Mar 2025
YoY Growth in year ended Mar 2026 is 530.00% vs -118.69% in Mar 2025
About Parker Agrochem Exports Ltd

Company Coordinates


