
Compare Parmax Pharma with Similar Stocks
Dashboard
With a Negative Book Value, the company has a Weak Long Term Fundamental Strength
- Poor long term growth as Net Sales has grown by an annual rate of -14.30% and Operating profit at 6.65% over the last 5 years
- Company's ability to service its debt is weak with a poor EBIT to Interest (avg) ratio of 0.66
The company has declared Negative results for the last 4 consecutive quarters
Risky - Negative EBITDA
Stock DNA
Pharmaceuticals & Biotechnology
INR 20 Cr (Micro Cap)
NA (Loss Making)
34
0.00%
-2.36
85.92%
-3.97
Total Returns (Price + Dividend) 
Parmax Pharma for the last several years.
Risk Adjusted Returns v/s
Returns Beta

News
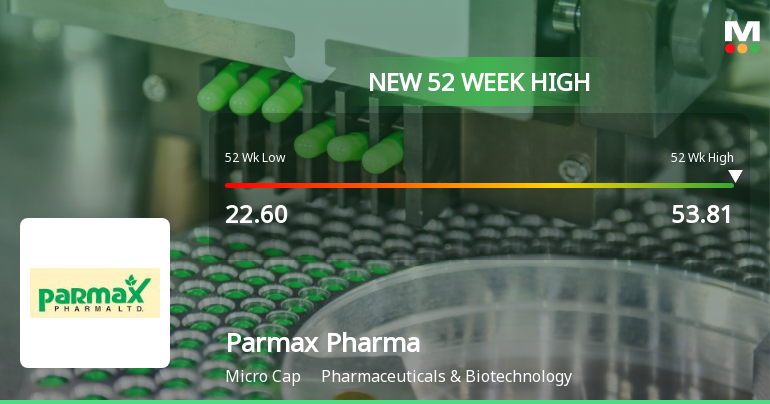
Broad-Based Technical Strength Lifts Parmax Pharma Ltd to 52-Week High of Rs 53.81
With a decisive 5% gap-up opening and a sustained rally to Rs 53.81, Parmax Pharma Ltd has surged to a fresh 52-week high, marking a 41.64% gain over the past year against a declining Sensex. This technical breakout underscores a strong momentum phase for the micro-cap pharmaceutical player.
Read full news article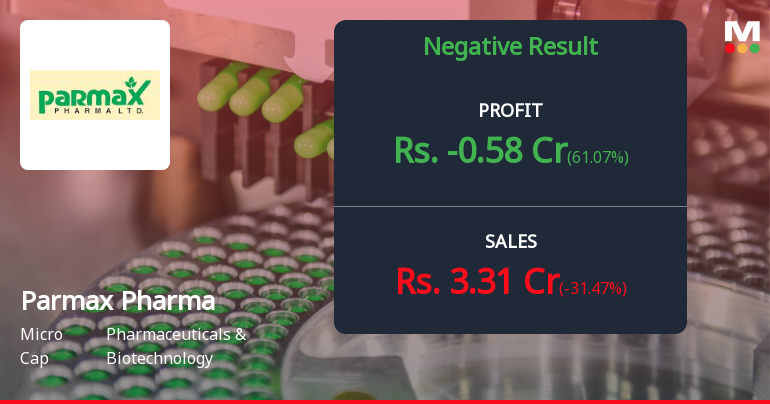
Parmax Pharma Q4 FY26: Mounting Losses Signal Deepening Crisis
Parmax Pharma Ltd., a micro-cap pharmaceutical company specialising in Active Pharmaceutical Ingredients (API) and Contract Manufacturing Operations (CMO), reported a net loss of ₹0.58 crores for Q4 FY26 (Jan-Mar'26), marking the seventh consecutive quarter of losses. Whilst the loss narrowed sequentially from ₹0.73 crores in Q3 FY26, it remains significantly lower than the ₹1.49 crores loss in Q4 FY25. The company's shares surged 16.88% to ₹52.00 following the results, despite the troubling financial performance, suggesting speculative trading rather than fundamental improvement.
Read full news article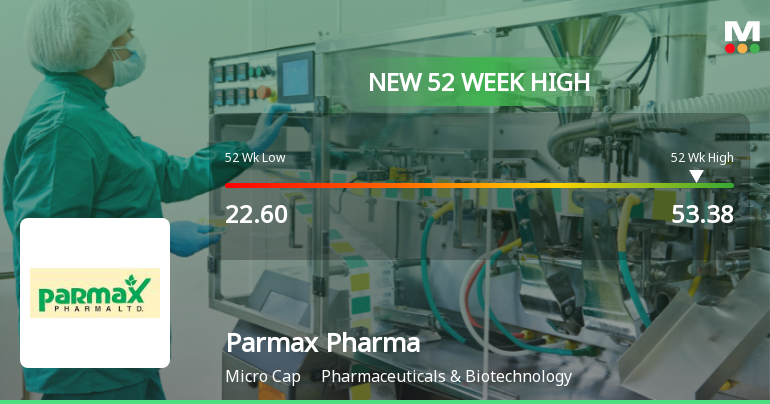
Broad-Based Technical Strength Lifts Parmax Pharma Ltd to 52-Week High of Rs 53.38
With a surge to Rs 53.38 on 4 Jun 2026, Parmax Pharma Ltd has reached a fresh 52-week high, propelled by a striking alignment of technical indicators and sustained price momentum that outpaces its sector and the broader market.
Read full news article Announcements
Results-Delay in Financial Results
03-Jun-2026 | Source : BSEResults for Financial Results for Quarter and Financial Year ended March 31 2026
Board Meeting Outcome for Outcome Of Board Meeting
03-Jun-2026 | Source : BSEReschedule of Boar Meeting and Outcome of Board Meeting
Board Meeting Intimation for Fund Raising
03-Jun-2026 | Source : BSEParmax Pharma Ltdhas informed BSE that the meeting of the Board of Directors of the Company is scheduled on 08/06/2026 inter alia to consider and approve Fund raising
Corporate Actions

No Upcoming Board Meetings

No Dividend history available

No Splits history available

No Bonus history available

No Rights history available
Quality key factors
Valuation key factors
Technicals key factors
 Technical Indicator Scale: Bearish, Mildly Bearish, Sideways, Mildly Bullish, Bullish Turned
 Shareholding Snapshot : Mar 2026
Shareholding Compare (%holding)
Non Institution
None
Held by 0 Schemes
Held by 0 FIIs
Alkesh Mahasukhlal Gopani (17.92%)
Gosalia Meena Alkesh (12.69%)
63.1%
Quarterly Results Snapshot (Standalone) - Mar'26 - YoY

YoY Growth in quarter ended Mar 2026 is -31.47% vs 13.38% in Mar 2025

YoY Growth in quarter ended Mar 2026 is 61.07% vs -2.76% in Mar 2025
Half Yearly Results Snapshot (Standalone) - Sep'25
Growth in half year ended Sep 2025 is -73.84% vs 212.43% in Sep 2024
Growth in half year ended Sep 2025 is -1,320.00% vs 92.16% in Sep 2024
Nine Monthly Results Snapshot (Standalone) - Dec'25
YoY Growth in nine months ended Dec 2025 is -62.34% vs 243.68% in Dec 2024
YoY Growth in nine months ended Dec 2025 is -505.08% vs 86.28% in Dec 2024
Annual Results Snapshot (Standalone) - Mar'26
YoY Growth in year ended Mar 2026 is -57.06% vs 155.20% in Mar 2025
YoY Growth in year ended Mar 2026 is -99.04% vs 63.65% in Mar 2025
About Parmax Pharma Ltd

Company Coordinates


