
Compare Parnax Lab with Similar Stocks
Stock DNA
Pharmaceuticals & Biotechnology
INR 153 Cr (Micro Cap)
11.00
21
0.00%
0.87
13.57%
1.52
Total Returns (Price + Dividend) 
Parnax Lab for the last several years.
Risk Adjusted Returns v/s
Returns Beta

News
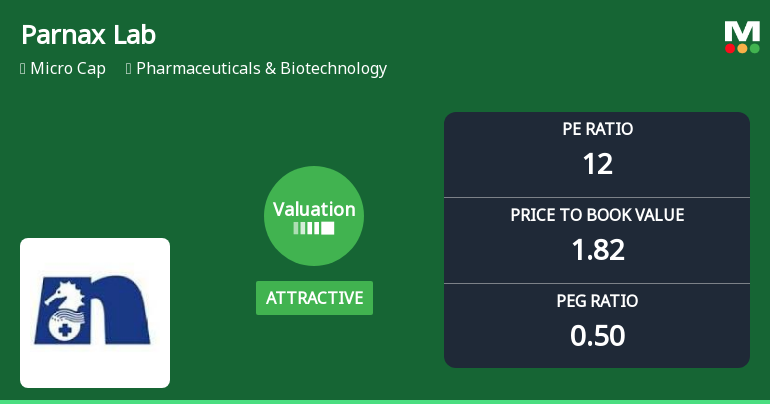
Parnax Lab Ltd Valuation Shifts Signal Renewed Price Attractiveness Amid Market Volatility
Parnax Lab Ltd, a micro-cap player in the Pharmaceuticals & Biotechnology sector, has seen a notable shift in its valuation parameters, moving from fair to attractive territory. Despite a recent downgrade in its Mojo Grade to Sell, the company’s price-to-earnings (P/E) and price-to-book value (P/BV) ratios now present a compelling case for value-oriented investors seeking exposure in this sector.
Read full news article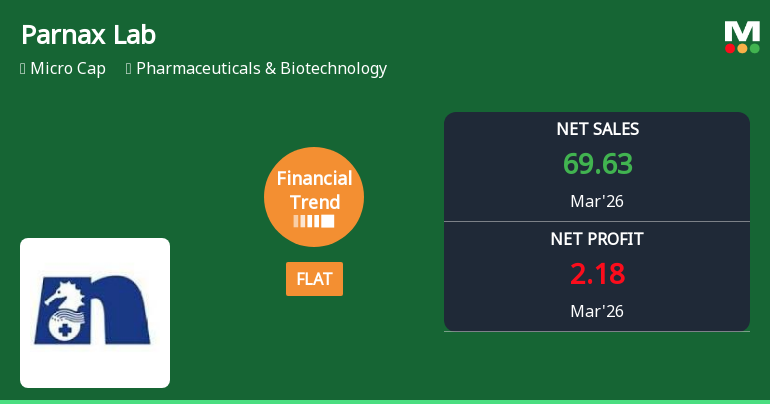
Parnax Lab Ltd Reports Flat Quarterly Financial Performance Amid Margin Pressures
Parnax Lab Ltd, a micro-cap player in the Pharmaceuticals & Biotechnology sector, has reported a flat financial performance for the quarter ended March 2026, signalling a notable shift from its previously positive growth trajectory. Despite achieving record quarterly net sales, the company’s profitability and margin metrics have deteriorated, prompting a downgrade in its Mojo Grade from Hold to Sell as of 25 March 2026.
Read full news article
Parnax Lab Ltd is Rated Sell
Parnax Lab Ltd is rated 'Sell' by MarketsMOJO, with this rating last updated on 29 May 2026. However, the analysis and financial metrics discussed here reflect the stock's current position as of 31 May 2026, providing investors with the latest insights into the company’s performance and outlook.
Read full news article Announcements
Compliances-Reg.24(A)-Annual Secretarial Compliance
30-May-2026 | Source : BSEPlease find enclosed herewith the Annual Secretarial Compliance Report under reg. 24(A) for the Year ended March 2026.
Board Meeting Outcome for Board Meeting Outcome For Consideration And Approval Of Standalone & Consolidated Audited Financial Results Of The Company For The Quarter And Year Ended 31St March 2026 Along With AuditorS Report Thereon.
28-May-2026 | Source : BSEBoard Meeting Outcome for Consideration and Approval of Standalone & Consolidated Audited Financial Results of the Company for the quarter and year ended 31st March 2026 along with Auditors Report thereon and Re-appointment of Mr. Yogesh Varia as an Independent Director.
Announcement under Regulation 30 (LODR)-Change in Management
28-May-2026 | Source : BSEPlease find enclosed herewith the Intimation regarding the Re-appointment of Mr. Yogesh K. Varia as an Independent Director of the Company for a second term of 5 consecutive years w.e.f. 28th May 2026.
Corporate Actions

No Upcoming Board Meetings

No Dividend history available

No Splits history available

No Bonus history available

No Rights history available
Quality key factors
Valuation key factors
Technicals key factors
 Technical Indicator Scale: Bearish, Mildly Bearish, Sideways, Mildly Bullish, Bullish Turned
 Shareholding Snapshot : Mar 2026
Shareholding Compare (%holding)
Promoters
9.4112
Held by 0 Schemes
Held by 0 FIIs
Binoy Baiju Shah (11.92%)
Suman Gupta (1.62%)
23.27%
Quarterly Results Snapshot (Consolidated) - Mar'26 - QoQ

QoQ Growth in quarter ended Mar 2026 is 10.63% vs 0.54% in Dec 2025
QoQ Growth in quarter ended Mar 2026 is -19.56% vs -25.34% in Dec 2025
Half Yearly Results Snapshot (Consolidated) - Sep'25
Growth in half year ended Sep 2025 is 17.77% vs 7.81% in Sep 2024

Growth in half year ended Sep 2025 is -6.63% vs 42.39% in Sep 2024
Nine Monthly Results Snapshot (Consolidated) - Dec'25
YoY Growth in nine months ended Dec 2025 is 29.00% vs -2.56% in Dec 2024
YoY Growth in nine months ended Dec 2025 is 11.74% vs 16.69% in Dec 2024
Annual Results Snapshot (Consolidated) - Mar'26
YoY Growth in year ended Mar 2026 is 32.39% vs -0.51% in Mar 2025
YoY Growth in year ended Mar 2026 is 2.26% vs 19.88% in Mar 2025
About Parnax Lab Ltd

Company Coordinates


