
Compare Parsvnath Devl. with Similar Stocks
Dashboard
With a Negative Book Value, the company has a Weak Long Term Fundamental Strength
- Low ability to service debt as the company has a high Debt to EBITDA ratio of -98.43 times
- The company has been able to generate a Return on Equity (avg) of 2.83% signifying low profitability per unit of shareholders funds
The company has declared Negative results for the last 7 consecutive quarters
Risky - Negative EBITDA
31.45% of Promoter Shares are Pledged
Below par performance in long term as well as near term
Stock DNA
Realty
INR 126 Cr (Micro Cap)
NA (Loss Making)
35
0.00%
-1.45
23.10%
-0.06
Total Returns (Price + Dividend) 
Latest dividend: 1.2700 per share ex-dividend date: Sep-15-2008
Risk Adjusted Returns v/s
Returns Beta

News

Parsvnath Developers Ltd Locks at Lower Circuit With 1.69% Loss — Sellers Queue, No Buyers in Sight
At Rs 2.91, Parsvnath Developers Ltd locked at its lower circuit on 23 Jun 2026, reflecting a 1.69% decline within a 2% price band. Sellers were lined up to exit, but the absence of buyers froze the price, creating unfilled supply and a trading halt at the floor price.
Read full news article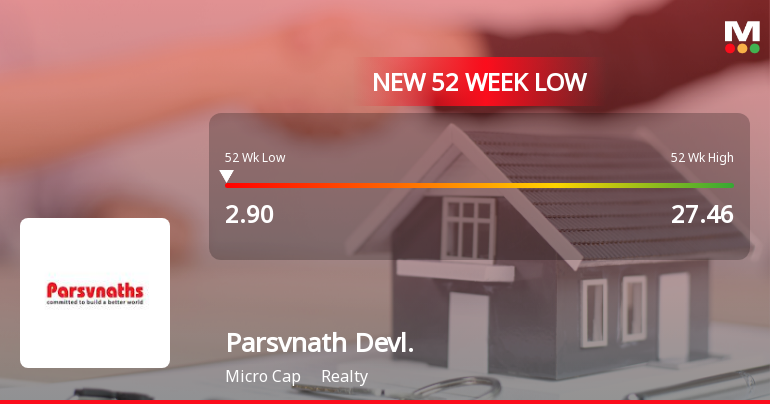
Five Consecutive Losses Push Parsvnath Developers Ltd to a New 52-Week Low
For the 21st consecutive session, Parsvnath Developers Ltd has closed lower, culminating in a fresh 52-week low of Rs 2.9 on 23 Jun 2026. This extended sell-off has dragged the stock down by 32.71% over this period, sharply underperforming its sector and the broader market indices.
Read full news article
Parsvnath Developers Ltd Locks at Lower Circuit With 1.99% Loss — Sellers Queue, No Buyers in Sight
At Rs 2.96, sellers were still queuing — but there were no buyers willing to take the other side. Parsvnath Developers Ltd locked at its lower circuit of 1.99% on 22 Jun 2026, with unfilled sell orders and a frozen price, underscoring persistent selling pressure in a micro-cap stock with limited liquidity.
Read full news article Announcements
Corporate Insolvency Resolution Process (CIRP)-Updates - Corporate Insolvency Resolution Process (CIRP)
17-Jun-2026 | Source : BSEPlease find attached intimation for appointment of Resolution Professional
Corporate Insolvency Resolution Process (CIRP)-List of Creditors
11-Jun-2026 | Source : BSEPlease find attached List of Creditors as on 27.05.2026
Corporate Insolvency Resolution Process (CIRP)-Intimation of meeting of Committee of Creditors
10-Jun-2026 | Source : BSE1st Meeting of the Committee of Creditors is scheduled to be held today i.e. Wednesday June 10 2026 by Interim Resolution Professional Mr. Manoj Kumar Anand.
Corporate Actions

No Upcoming Board Meetings

Parsvnath Developers Ltd has declared 30% dividend, ex-date: 15 Sep 08

Parsvnath Developers Ltd has announced 5:10 stock split, ex-date: 18 Oct 10

No Bonus history available

No Rights history available
Quality key factors
Valuation key factors
Technicals key factors
 Technical Indicator Scale: Bearish, Mildly Bearish, Sideways, Mildly Bullish, Bullish Turned
 Shareholding Snapshot : Mar 2026
Shareholding Compare (%holding)
Promoters
31.4517
Held by 0 Schemes
Held by 5 FIIs (1.23%)
Pradeep Kumar Jain & Sons Huf (16.23%)
Idbi Trusteeship Services Limited (5.16%)
27.24%
Quarterly Results Snapshot (Consolidated) - Dec'25 - QoQ

QoQ Growth in quarter ended Dec 2025 is 13.12% vs -14.70% in Sep 2025
QoQ Growth in quarter ended Dec 2025 is 6.86% vs -160.68% in Sep 2025
Half Yearly Results Snapshot (Consolidated) - Sep'25
Growth in half year ended Sep 2025 is -13.21% vs -19.30% in Sep 2024

Growth in half year ended Sep 2025 is 6.98% vs 15.28% in Sep 2024
Nine Monthly Results Snapshot (Consolidated) - Dec'25
YoY Growth in nine months ended Dec 2025 is -7.78% vs -48.47% in Dec 2024
YoY Growth in nine months ended Dec 2025 is -36.93% vs 9.20% in Dec 2024
Annual Results Snapshot (Consolidated) - Mar'25
YoY Growth in year ended Mar 2025 is -45.04% vs 4.92% in Mar 2024
YoY Growth in year ended Mar 2025 is 41.78% vs 25.96% in Mar 2024
About Parsvnath Developers Ltd

Company Coordinates


