Parvati Sweetner

  • Market Cap: Micro Cap
  • Industry: Sugar
  • ISIN: INE295Z01015
  • NSEID:
  • BSEID: 541347
INR
8.38
-0.71 (-7.81%)
BSENSE

Aug 25, 03:30 PM

BSE+NSE Vol: 362228

  • Price Points
  • Score
  • Mojo Parameters
  • Total Return
  • News and Corporate Actions
  • Key factors
  • Shareholding
  • Financials
  • CompanyCV
stock-summaryPrice Point
High/Low

1Day

52 Week

Valuation
Technical
Day's Volume

CASH

3.62 lacs (69.24%) Volume

Shareholding (Jun 2026)

FII

0.00%

Held by 0 FIIs

DII

0.03%

Held by 0 DIIs

Promoter

66.00%

Why is Parvati Sweetners and Power Ltd falling/rising?

25-Aug-2026

As of 24-Aug, Parvati Sweetners and Power Ltd's stock price has risen to Rs 9.09, reflecting an 18.36% increase. This surge is driven by strong recent performance, positive trading activity, and heightened investor interest.

As of 24-Aug, Parvati Sweetners and Power Ltd is experiencing a significant rise in its stock price, currently at Rs 9.09, reflecting a change of 1.41 or an increase of 18.36%. This upward movement can be attributed to several key factors. <BR><BR>Firstly, the stock has shown remarkable performance over the past week, with a gain of 40.71%, while the benchmark Sensex has declined by 0.46%. Over the past month, the stock has also outperformed the Sensex, rising by 39.42% compared to the index's increase of 1.72%. Year-to-date, the stock has risen by 28.21%, contrasting sharply with the Sensex's decline of 9.21%.<BR><BR>Today's trading activity further highlights the stock's strength. It opened with a gap up of 9.11% and reached an intraday high of Rs 9.21, marking a 19.92% increase. The stock has been gaining for the last two days, accumulating a total return of 43.68% during this period. Additionally, the stock has demonstrated high volatility today, with an intraday volatility of 8.23%, indicating active trading and investor interest.<BR><BR>Moreover, the stock is trading above its 5-day, 20-day, 50-day, 100-day, and 200-day moving averages, which is a positive technical indicator. There has also been a notable increase in investor participation, with delivery volume on 21 August rising by 729.91% compared to the 5-day average, suggesting heightened interest from investors.<BR><BR>In summary, the combination of strong recent performance, positive trading activity, and increased investor participation are key reasons for the rising stock price of Parvati Sweetners and Power Ltd.

View full answer

Should I buy, sell or hold Parvati Sweetners and Power Ltd?

14-Aug-2026

Who are in the management team of Parvati Sweetner?

14-Aug-2026

The management team of Parvati Sweetner includes Poonam Chouksey (Chairman & Managing Director), Anupam Chouksey (Whole-Time Director), Pooja Shree Chouksey (Non-Executive Director), and three Independent Non-Executive Directors: Vineet Richhariya, Kuldeep Mudgal, and Dhakre Rakesh Singh.

The management team of Parvati Sweetner includes the following individuals:<BR><BR>1. **Poonam Chouksey** - Chairman & Managing Director<BR>2. **Anupam Chouksey** - Whole-Time Director & Executive Director<BR>3. **Pooja Shree Chouksey** - Non-Executive & Non-Independent Director<BR>4. **Vineet Richhariya** - Independent Non-Executive Director<BR>5. **Kuldeep Mudgal** - Independent Non-Executive Director<BR>6. **Dhakre Rakesh Singh** - Independent Non-Executive Director<BR><BR>If you have any more questions about the company or its management, feel free to ask!

View full answer

What does Parvati Sweetner do?

14-Aug-2026

Parvati Sweetners and Power Ltd is a micro-cap manufacturer of sugar and its by-products, incorporated in 2011. As of June 2026, it reported net sales of 36 Cr and a market cap of INR 100 Cr.

Overview: <BR>Parvati Sweetners and Power Ltd is a manufacturer of sugar and its by-products, operating in the sugar industry within the micro-cap market segment.<BR><BR>History: <BR>The company was incorporated as 'Parvati Sweetners and Power Private Limited' in 2011 and later converted into a public company, changing its name to 'Parvati Sweetners and Power Limited' on January 24, 2012. The latest quarterly results reported net sales and net profit for June 2026.<BR><BR>Financial Snapshot: <BR>Most recent Net Sales: 36 Cr (Quarterly Results - Jun 2026) <BR>Most recent Net Profit: 0 Cr (Quarterly Results - Jun 2026) <BR>Market-cap value: INR 100 Cr (Micro Cap)<BR><BR>Key Metrics: <BR>P/E: N/A <BR>Industry P/E: 20 <BR>Dividend Yield: 0.00% <BR>Debt-Equity: 0.15 <BR>Return on Equity: -14.68% <BR>Price to Book: 1.13<BR><BR>Contact Details: <BR>Address: Hall No 2 Shopping Complex, Gomantika Parisar Jawahar Chow Indore Madhya Pradesh : 452003 <BR>Tel: 91-755-4009254 <BR>Email: info@Parvatisweetners.com <BR>Website: http://www.parvatisweetners.com

View full answer

Who are the peers of the Parvati Sweetner?

14-Aug-2026

Parvati Sweetner's peers include Rana Sugars, Indian Sucrose, Dhampur.Spl.Sug., and others, with Dhampur.Spl.Sug. showing excellent growth and the highest 1-year return at 57.11%, while Parvati Sweetner has a 1-year return of -15.81%. Most peers exhibit below-average growth and management risk, with several also experiencing negative returns in the last six months.

Peers: The peers of Parvati Sweetner are Rana Sugars, Indian Sucrose, Dhampur.Spl.Sug., Vishwaraj Sugar, Rajshree Sugars, Piccadily Sugar, Kesar Enterprise, Gayatri Sugars, and The Ravalgaon.<BR><BR>Quality Snapshot: Excellent growth is observed at Dhampur.Spl.Sug., while Average management risk is found at Rana Sugars and Indian Sucrose, and the rest. Below Average management risk is noted at Dhampur.Spl.Sug., Vishwaraj Sugar, Rajshree Sugars, Parvati Sweetner, Piccadily Sugar, Kesar Enterprise, The Ravalgaon, and the rest. Below Average growth is seen at Rana Sugars, Indian Sucrose, Vishwaraj Sugar, Rajshree Sugars, Parvati Sweetner, Piccadily Sugar, Kesar Enterprise, The Ravalgaon, and the rest. Good capital structure is noted at Dhampur.Spl.Sug., while Average capital structure is found at Indian Sucrose, and Below Average capital structure is observed at the rest.<BR><BR>Return Snapshot: The peer with the highest 1-year return is Dhampur.Spl.Sug. at 57.11%, while the peer with the lowest 1-year return is Pruden. Sugar at -67.25%. Parvati Sweetner's 1-year return is -15.81%, which is better than Pruden. Sugar but worse than Dhampur.Spl.Sug. Additionally, Vishwaraj Sugar, Piccadily Sugar, Kesar Enterprise, Gayatri Sugars, and The Ravalgaon all have negative six-month returns.

View full answer

How big is Parvati Sweetner?

14-Aug-2026

As of 14th August, Parvati Sweetners and Power Ltd has a market capitalization of 96.65 Cr, with recent net sales of 51.01 Cr and a net profit loss of 9.22 Cr over the last four quarters.

As of 14th August, <BR><BR>Market Cap: Parvati Sweetners and Power Ltd has a market capitalization of 96.65 Cr, categorizing it as a Micro Cap company.<BR><BR>Recent Quarterly Performance: The sum of Net Sales for the latest 4 quarters is 51.01 Cr, while the sum of Net Profit for the same period reflects a loss of 9.22 Cr.<BR><BR>Balance Sheet Snapshot: The reporting period for the balance sheet is March 2025, with Shareholder's Funds amounting to 101.86 Cr and Total Assets valued at 140.11 Cr.

View full answer

When is the next results date for Parvati Sweetners and Power Ltd?

07-Aug-2026

The next results date for Parvati Sweetners and Power Ltd is 12 August 2026.

The next results date for Parvati Sweetners and Power Ltd is scheduled for 12 August 2026.

View full answer

Are Parvati Sweetners and Power Ltd latest results good or bad?

01-Jun-2026

Parvati Sweetners and Power Ltd's latest results are concerning, showing a net loss of ₹2.48 crores despite a significant revenue increase of 25,000%. The company faces ongoing operational challenges, leading to a negative outlook and a recommendation for investors to avoid the stock.

Parvati Sweetners and Power Ltd's latest results for Q4 FY26 indicate a challenging financial situation. The company reported a net loss of ₹2.48 crores, which is a significant decline from a profit of ₹1.84 crores in the same quarter last year. This marks a widening of losses year-on-year, highlighting persistent operational difficulties.<BR><BR>On a more positive note, the company experienced a dramatic increase in revenue, reporting ₹15.06 crores for the quarter, which represents a staggering 25,000% growth compared to the previous quarter. However, this revenue growth has not translated into profitability, as the operating margin is deeply negative at -7.90%. This indicates that the core business is struggling to generate profits even before accounting for interest and depreciation.<BR><BR>The return on equity (ROE) is also concerning, standing at -9.18%, which suggests that the company is not effectively utilizing its equity to generate returns. Overall, while there is a notable increase in revenue, the financial performance is overshadowed by the ongoing losses and operational challenges, leading to a negative outlook for the company. <BR><BR>Investors may want to exercise caution, as the stock has seen a decline of 2.19% recently, and it is trading significantly below its 52-week high. The overall assessment points to a company in severe operational distress, and the recommendation for potential investors is to avoid entering the stock at this time.

View full answer

How has been the historical performance of Parvati Sweetner?

17-Nov-2025

Parvati Sweetner has experienced declining financial performance, with net sales dropping from INR 89.19 crore in March 2023 to INR 53.57 crore in March 2025, alongside reduced profits and total assets. The company faces challenges in maintaining revenue and profitability.

Answer:<BR>The historical performance of Parvati Sweetner shows a fluctuating trend in key financial metrics over the years.<BR><BR>Breakdown:<BR>Parvati Sweetner's net sales have seen a decline from INR 89.19 crore in March 2023 to INR 53.57 crore in March 2025. The total operating income followed a similar trend, decreasing from INR 89.19 crore in March 2023 to INR 53.57 crore in March 2025. Raw material costs peaked at INR 70.46 crore in March 2022 but dropped significantly to INR 13.73 crore by March 2025. The operating profit (PBDIT) also decreased from INR 11.07 crore in March 2024 to INR 7.27 crore in March 2025, reflecting a declining operating profit margin of 13.25% in March 2025 compared to 13.61% in March 2024. Profit before tax fell sharply to INR 0.04 crore in March 2025 from INR 3.00 crore in March 2024, while profit after tax decreased to INR 0.58 crore in March 2025 from INR 1.43 crore in March 2024. Total assets decreased from INR 168.68 crore in March 2024 to INR 140.11 crore in March 2025, and total liabilities also declined from INR 168.68 crore to INR 140.11 crore in the same period. Cash flow from operating activities remained positive at INR 4.00 crore in March 2024 but showed a net cash outflow of INR 3.00 crore in March 2023. Overall, the financial performance of Parvati Sweetner indicates challenges in maintaining revenue and profitability in recent years.

View full answer

Who are the top shareholders of the Parvati Sweetner?

17-Jul-2025

The top shareholders of Parvati Sweetner include Ananjay Construction And Contracts Private Limited with 31.5%, followed by public shareholder Vijay Suryawanshi at 5.36%. Individual investors hold 32.18% of the shares, with no pledged promoter holdings or involvement from mutual funds or foreign institutional investors.

The top shareholders of Parvati Sweetner include the promoters, with Ananjay Construction And Contracts Private Limited holding the largest stake at 31.5%. Additionally, the highest public shareholder is Vijay Suryawanshi, who owns 5.36% of the company. Individual investors collectively hold 32.18% of the shares. Notably, there are no pledged promoter holdings, and the company does not have any mutual funds or foreign institutional investors (FIIs) involved.

View full answer

Is Parvati Sweetner overvalued or undervalued?

09-Jun-2025

As of February 18, 2025, Parvati Sweetner is considered undervalued with an attractive valuation grade, despite having a high PE ratio of 112.60 and underperforming the Sensex with a return of -27.57% over the past year.

As of 18 February 2025, Parvati Sweetner's valuation grade has moved from fair to attractive, indicating a more favorable assessment. The company is currently considered undervalued. Key ratios include a PE ratio of 112.60, an EV to EBITDA of 18.72, and a ROCE of 2.27%. <BR><BR>In comparison to its peers, E.I.D.-Parry (India) Ltd. has a PE ratio of 27.55 and an EV to EBITDA of 5.63, while Balrampur Chini Mills Ltd. shows a PE ratio of 28.14 and an EV to EBITDA of 21.19. These figures suggest that Parvati Sweetner is trading at a premium compared to its peers, yet its attractive valuation grade indicates potential for growth. Notably, the stock has underperformed the Sensex over the past year, with a return of -27.57% compared to the Sensex's 7.57%, reinforcing the notion of undervaluation amidst broader market trends.

View full answer

What is the technical trend for Parvati Sweetner?

09-Jun-2025

As of May 26, 2025, Parvati Sweetner's technical trend is mildly bearish, with mixed signals from indicators like the MACD and KST across different time frames, suggesting a weak bearish sentiment overall.

As of 26 May 2025, the technical trend for Parvati Sweetner has changed from bearish to mildly bearish. The weekly MACD is mildly bullish, but the monthly MACD remains bearish, indicating mixed signals across different time frames. The RSI shows no signal on both weekly and monthly charts, suggesting a lack of momentum. Bollinger Bands and moving averages on the daily and weekly time frames are mildly bearish, reinforcing the overall bearish sentiment. The KST is mildly bullish on the weekly but bearish on the monthly, adding to the mixed outlook. Dow Theory indicates a mildly bearish stance on the weekly chart, with no trend on the monthly. Overall, the current technical stance is mildly bearish, reflecting a weak bearish sentiment with some bullish indicators on the weekly time frame.

View full answer

Has Parvati Sweetner declared dividend?

06-Jun-2025

No Dividend History Available

iScoreScore
Click here to find our call on this stock
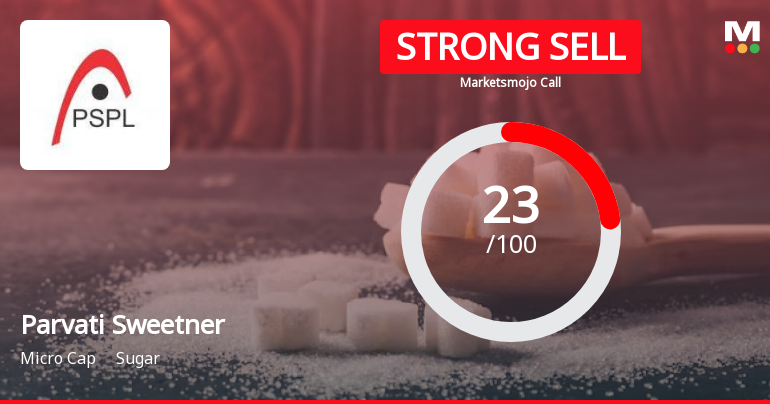
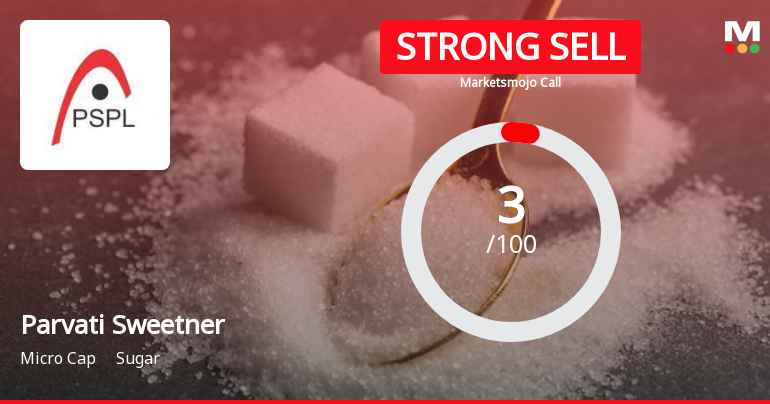
Strong Sell
Sell
Hold
Buy
Strong Buy

Dashboard

1

Weak Long Term Fundamental Strength with a -209.95% CAGR growth in Operating Profits over the last 5 years

  • Company's ability to service its debt is weak with a poor EBIT to Interest (avg) ratio of -0.05
  • The company has been able to generate a Return on Equity (avg) of 1.03% signifying low profitability per unit of shareholders funds
2

Risky - Negative EBITDA

stock-summaryMojo Parameters

Mojo Parameters

Loading Valuation Snapshot...

Stock DNA

stock-summary
Industry

Sugar

stock-summary
Market cap

INR 145 Cr (Micro Cap)

stock-summary
P/E

NA (Loss Making)

stock-summary
Industry P/E

24

stock-summary
Dividend Yield

0.00%

stock-summary
Debt Equity

0.15

stock-summary
Return on Equity

-10.38%

stock-summary
Price to Book

1.55

Revenue and Profits:
Net Sales:
36 Cr
(Quarterly Results - Jun 2026)
Net Profit:
0 Cr
stock-summaryTotal Returns
Total Returns (Price + Dividend) stock-summary
Dividend Yield (0%)
TimePeriod
Price Return
Dividend Return
Total Return
3 Months
21.45%
0%
21.45%
6 Months
6.48%
0%
6.48%
1 Year
15.11%
0%
15.11%
2 Years
-20.42%
0%
-20.42%
3 Years
-11.04%
0%
-11.04%
4 Years
-5.52%
0%
-5.52%
5 Years
74.22%
0%
74.22%

Parvati Sweetner for the last several years.

Risk Adjusted Returns v/s stock-summary
Returns Beta
Icon
Beta has not been calculated since enough price history is not available
stock-summaryNews & Corporate Actions

Announcements stock-summary

Announcement under Regulation 30 (LODR)-Newspaper Publication

17-Aug-2026 | Source : BSE

Newspaper Clipping Submission.

Corporate Announcement/Information Under Regulation 42 Of The SEBI (LODR) Regulations 2015 For Book Closure And Intimation Of Date Of The 15Th Annual General Meeting Etc.

12-Aug-2026 | Source : BSE

Book Closure

Board Meeting Outcome for Outcome Of Board Meeting Held On 12Th August 2026 Under Regulation 30 Of Securities And Exchange Board Of India (Listing Obligations And Disclosure Requirements) Regulations 2015 (SEBI Listing Regulations)

12-Aug-2026 | Source : BSE

Corporate Actions stock-summary

stock-summary
BOARD MEETING

No Upcoming Board Meetings

stock-summary
DIVIDEND

No Dividend history available

stock-summary
SPLITS

No Splits history available

stock-summary
BONUS

No Bonus history available

stock-summary
RIGHTS

Parvati Sweetners and Power Ltd has announced 17:26 rights issue, ex-date: 08 Feb 23

stock-summaryKey Factors

Quality key factors stock-summary

Factor
Value
Sales Growth (5y)
-4.90%
EBIT Growth (5y)
-209.95%
EBIT to Interest (avg)
-0.05
Debt to EBITDA (avg)
0.44
Net Debt to Equity (avg)
0.15
Sales to Capital Employed (avg)
0.49
Tax Ratio
6.38%
Dividend Payout Ratio
0
Pledged Shares
0
Institutional Holding
0.03%
ROCE (avg)
1.38%
ROE (avg)
1.03%

Valuation key factors

Factor
Value
P/E Ratio
NA (Loss Making)
Industry P/E
24
Price to Book Value
1.40
EV to EBIT
-16.79
EV to EBITDA
-34.56
EV to Capital Employed
1.35
EV to Sales
2.70
PEG Ratio
NA
Dividend Yield
NA
ROCE (Latest)
-11.72%
ROE (Latest)
-10.38%

Technicals key factors

Indicator
Weekly
Monthly
MACD
Mildly Bullish
Mildly Bullish
RSI
Bearish
No Signal
Bollinger Bands
Bullish
Sideways
Moving Averages
Mildly Bearish (Daily)
KST
Mildly Bullish
Mildly Bullish
Dow Theory
Mildly Bullish
Mildly Bearish
stock-summary Technical Indicator Scale: Bearish, Mildly Bearish, Sideways, Mildly Bullish, Bullish  Turned 
stock-summaryShareholding
Shareholding Snapshot : Jun 2026stock-summary
Shareholding Compare (%holding) stock-summary
Majority shareholders

Promoters

Pledged Promoter Holdings

None

Mutual Funds

Held by 0 Schemes

FIIs

Held by 0 FIIs

Promoter with highest holding

Ananjay Construction And Contracts Private Limited (31.5%)

Highest Public shareholder

Vijay Surwansi (5.36%)

Individual Investors Holdings

27.58%

stock-summaryFinancial
[
  {
    "link": "quarterly",
    "btn_text": "All Quarterly Results",
    "header": "Quarterly Results Snapshot (Standalone) - Jun'26 - QoQ",
    "rhs": [
      {
        "prefix": "Net Sales ",
        "suffix": "QoQ Growth in quarter ended Jun 2026 is 137.25% vs 25,000.00% in Mar 2026",
        "dir": -1
      },
      {
        "prefix": "Standalone Net Profit ",
        "suffix": "QoQ Growth in quarter ended Jun 2026 is 112.90% vs 33.51% in Mar 2026",
        "dir": 1
      }
    ],
    "table": {
      "header": [
        "Jun'26",
        "Mar'26",
        "Change(%)"
      ],
      "body": [
        {
          "field": "Net Sales",
          "val1": "35.73",
          "val2": "15.06",
          "chgp": "137.25%",
          "chgp_class": "positive"
        },
        {
          "field": "Operating Profit (PBDIT) excl Other Income",
          "val1": "1.54",
          "val2": "-1.19",
          "chgp": "229.41%",
          "chgp_class": "positive"
        },
        {
          "field": "Interest",
          "val1": "0.37",
          "val2": "0.50",
          "chgp": "-26.00%",
          "chgp_class": "positive"
        },
        {
          "field": "Exceptional Items",
          "val1": "0.00",
          "val2": "0.00",
          "chgp": "",
          "chgp_class": "neutral"
        },
        {
          "field": "Standalone Net Profit",
          "val1": "0.32",
          "val2": "-2.48",
          "chgp": "112.90%",
          "chgp_class": "positive"
        },
        {
          "field": "Operating Profit Margin (Excl OI)",
          "val1": "4.31%",
          "val2": "-7.90%",
          "chgp": "12.21%",
          "chgp_class": "positive"
        }
      ]
    }
  },
  {
    "link": "half-yearly",
    "btn_text": "All Half Yearly Results",
    "header": "Half Yearly Results Snapshot (Standalone) - Sep'25",
    "rhs": [
      {
        "prefix": "Net Sales ",
        "suffix": " Growth in half year ended Sep 2025 is -92.53% vs 12.16% in Sep 2024",
        "dir": -1
      },
      {
        "prefix": "Standalone Net Profit ",
        "suffix": " Growth in half year ended Sep 2025 is -8,637.50% vs -77.78% in Sep 2024",
        "dir": -1
      }
    ],
    "table": {
      "header": [
        "Sep'25",
        "Sep'24",
        "Change(%)"
      ],
      "body": [
        {
          "field": "Net Sales",
          "val1": "2.86",
          "val2": "38.29",
          "chgp": "-92.53%",
          "chgp_class": "negative"
        },
        {
          "field": "Operating Profit (PBDIT) excl Other Income",
          "val1": "-4.03",
          "val2": "3.59",
          "chgp": "-212.26%",
          "chgp_class": "negative"
        },
        {
          "field": "Interest",
          "val1": "1.16",
          "val2": "1.54",
          "chgp": "-24.68%",
          "chgp_class": "positive"
        },
        {
          "field": "Exceptional Items",
          "val1": "0.00",
          "val2": "0.00",
          "chgp": "",
          "chgp_class": "neutral"
        },
        {
          "field": "Standalone Net Profit",
          "val1": "-6.83",
          "val2": "0.08",
          "chgp": "-8,637.50%",
          "chgp_class": "negative"
        },
        {
          "field": "Operating Profit Margin (Excl OI)",
          "val1": "-140.91%",
          "val2": "9.38%",
          "chgp": "-150.29%",
          "chgp_class": "negative"
        }
      ]
    }
  },
  {
    "link": "nine-monthly",
    "btn_text": "All Nine Monthly Results",
    "header": "Nine Monthly Results Snapshot (Standalone) - Dec'25",
    "rhs": [
      {
        "prefix": "Net Sales ",
        "suffix": "YoY Growth in nine months ended Dec 2025 is -93.07% vs -4.09% in Dec 2024",
        "dir": -1
      },
      {
        "prefix": "Standalone Net Profit ",
        "suffix": "YoY Growth in nine months ended Dec 2025 is -738.10% vs -290.91% in Dec 2024",
        "dir": -1
      }
    ],
    "table": {
      "header": [
        "Dec'25",
        "Dec'24",
        "Change(%)"
      ],
      "body": [
        {
          "field": "Net Sales",
          "val1": "2.92",
          "val2": "42.16",
          "chgp": "-93.07%",
          "chgp_class": "negative"
        },
        {
          "field": "Operating Profit (PBDIT) excl Other Income",
          "val1": "-6.55",
          "val2": "3.81",
          "chgp": "-271.92%",
          "chgp_class": "negative"
        },
        {
          "field": "Interest",
          "val1": "1.68",
          "val2": "2.13",
          "chgp": "-21.13%",
          "chgp_class": "positive"
        },
        {
          "field": "Exceptional Items",
          "val1": "0.00",
          "val2": "0.00",
          "chgp": "",
          "chgp_class": "neutral"
        },
        {
          "field": "Standalone Net Profit",
          "val1": "-10.56",
          "val2": "-1.26",
          "chgp": "-738.10%",
          "chgp_class": "negative"
        },
        {
          "field": "Operating Profit Margin (Excl OI)",
          "val1": "-224.32%",
          "val2": "9.04%",
          "chgp": "-233.36%",
          "chgp_class": "negative"
        }
      ]
    }
  },
  {
    "link": "annual",
    "btn_text": "All Annual Results",
    "header": "Annual Results Snapshot (Standalone) - Mar'26",
    "rhs": [
      {
        "prefix": "Net Sales ",
        "suffix": "YoY Growth in year ended Mar 2026 is -66.42% vs -33.52% in Mar 2025",
        "dir": -1
      },
      {
        "prefix": "Standalone Net Profit ",
        "suffix": "YoY Growth in year ended Mar 2026 is -2,350.00% vs -59.44% in Mar 2025",
        "dir": -1
      }
    ],
    "table": {
      "header": [
        "Mar'26",
        "Mar'25",
        "Change(%)"
      ],
      "body": [
        {
          "field": "Net Sales",
          "val1": "17.99",
          "val2": "53.57",
          "chgp": "-66.42%",
          "chgp_class": "negative"
        },
        {
          "field": "Operating Profit (PBDIT) excl Other Income",
          "val1": "-7.72",
          "val2": "7.10",
          "chgp": "-208.73%",
          "chgp_class": "negative"
        },
        {
          "field": "Interest",
          "val1": "2.19",
          "val2": "2.91",
          "chgp": "-24.74%",
          "chgp_class": "positive"
        },
        {
          "field": "Exceptional Items",
          "val1": "0.00",
          "val2": "0.00",
          "chgp": "",
          "chgp_class": "neutral"
        },
        {
          "field": "Standalone Net Profit",
          "val1": "-13.05",
          "val2": "0.58",
          "chgp": "-2,350.00%",
          "chgp_class": "negative"
        },
        {
          "field": "Operating Profit Margin (Excl OI)",
          "val1": "-42.91%",
          "val2": "13.25%",
          "chgp": "-56.16%",
          "chgp_class": "negative"
        }
      ]
    }
  }
]

Quarterly Results Snapshot (Standalone) - Jun'26 - QoQstock-summary

Jun'26
Mar'26
Change(%)
Net Sales
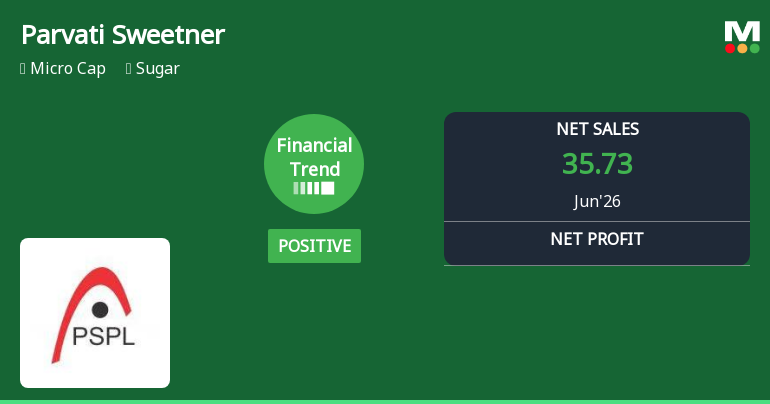
35.73
15.06
137.25%
Operating Profit (PBDIT) excl Other Income
1.54
-1.19
229.41%
Interest
0.37
0.50
-26.00%
Exceptional Items
0.00
0.00
Standalone Net Profit
0.32
-2.48
112.90%
Operating Profit Margin (Excl OI)
4.31%
-7.90%
12.21%
Values in Rs Cr.
Direction Arrows
Net Sales

QoQ Growth in quarter ended Jun 2026 is 137.25% vs 25,000.00% in Mar 2026

Direction Arrows
Standalone Net Profit

QoQ Growth in quarter ended Jun 2026 is 112.90% vs 33.51% in Mar 2026

Half Yearly Results Snapshot (Standalone) - Sep'25stock-summary

Sep'25
Sep'24
Change(%)
Net Sales
2.86
38.29
-92.53%
Operating Profit (PBDIT) excl Other Income
-4.03
3.59
-212.26%
Interest
1.16
1.54
-24.68%
Exceptional Items
0.00
0.00
Standalone Net Profit
-6.83
0.08
-8,637.50%
Operating Profit Margin (Excl OI)
-140.91%
9.38%
-150.29%
Values in Rs Cr.
Direction Arrows
Net Sales

Growth in half year ended Sep 2025 is -92.53% vs 12.16% in Sep 2024

Direction Arrows
Standalone Net Profit

Growth in half year ended Sep 2025 is -8,637.50% vs -77.78% in Sep 2024

Nine Monthly Results Snapshot (Standalone) - Dec'25stock-summary

Dec'25
Dec'24
Change(%)
Net Sales
2.92
42.16
-93.07%
Operating Profit (PBDIT) excl Other Income
-6.55
3.81
-271.92%
Interest
1.68
2.13
-21.13%
Exceptional Items
0.00
0.00
Standalone Net Profit
-10.56
-1.26
-738.10%
Operating Profit Margin (Excl OI)
-224.32%
9.04%
-233.36%
Values in Rs Cr.
Direction Arrows
Net Sales

YoY Growth in nine months ended Dec 2025 is -93.07% vs -4.09% in Dec 2024

Direction Arrows
Standalone Net Profit

YoY Growth in nine months ended Dec 2025 is -738.10% vs -290.91% in Dec 2024

Annual Results Snapshot (Standalone) - Mar'26stock-summary

Mar'26
Mar'25
Change(%)
Net Sales
17.99
53.57
-66.42%
Operating Profit (PBDIT) excl Other Income
-7.72
7.10
-208.73%
Interest
2.19
2.91
-24.74%
Exceptional Items
0.00
0.00
Standalone Net Profit
-13.05
0.58
-2,350.00%
Operating Profit Margin (Excl OI)
-42.91%
13.25%
-56.16%
Values in Rs Cr.
Direction Arrows
Net Sales

YoY Growth in year ended Mar 2026 is -66.42% vs -33.52% in Mar 2025

Direction Arrows
Standalone Net Profit

YoY Growth in year ended Mar 2026 is -2,350.00% vs -59.44% in Mar 2025

stock-summaryCompany CV
About Parvati Sweetners and Power Ltd stock-summary
stock-summary
Parvati Sweetners and Power Ltd
Micro Cap
Sugar
Parvati Sweetners & Power Limited was incorporated as 'Parvati Sweetners and Power Private Limited' on December 13, 2011. The Company was later converted into a Public Company and the name got changed to 'Parvati Sweetners and Power Limited' on 24 January, 2012. The Company is a manufacturer of sugar, and its by-products. The Company is a part of the LNCT Group, Bhopal (M.P.), whose core businesses includes sugar and its bye products.
Company Coordinates stock-summary
Company Details
Hall No 2 Shopping Complex, Gomantika Parisar Jawahar Chow Indore Madhya Pradesh : 452003
stock-summary
Tel: 91-755-4009254
stock-summary
info@Parvatisweetners.com
Registrar Details
Link Intime India Pvt Ltd, C-13 Pannalal Silk Compound, L B S Marg, Bhandup , Mumbai