
Compare Parvati Sweetner with Similar Stocks
Dashboard
With a Operating Losses, the company has a Weak Long Term Fundamental Strength
- Company's ability to service its debt is weak with a poor EBIT to Interest (avg) ratio of -0.03
- The company has been able to generate a Return on Equity (avg) of 1.03% signifying low profitability per unit of shareholders funds
Negative results in Mar 26
Risky - Negative EBITDA
Consistent Underperformance against the benchmark over the last 3 years
Stock DNA
Sugar
INR 100 Cr (Micro Cap)
NA (Loss Making)
21
0.00%
0.15
-14.68%
1.12
Total Returns (Price + Dividend) 
Parvati Sweetner for the last several years.
Risk Adjusted Returns v/s
Returns Beta

News
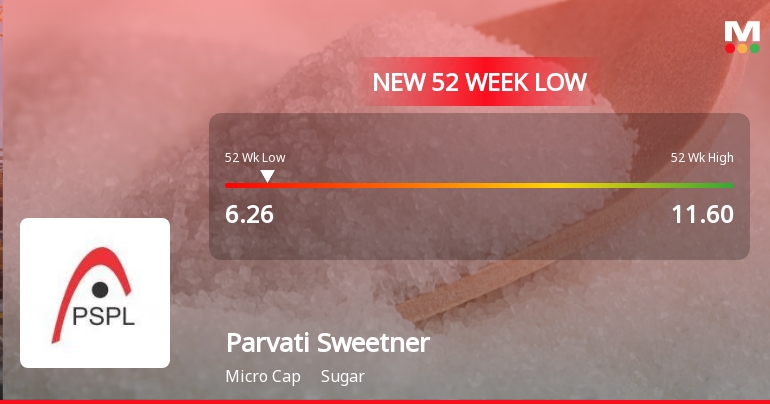
Parvati Sweetners and Power Ltd Falls to 52-Week Low of Rs 6.26 as Sell-Off Deepens
A sustained decline has pushed Parvati Sweetners and Power Ltd to a fresh 52-week low of Rs 6.26 on 14 Jul 2026, marking a notable underperformance against the broader market and its sector peers.
Read full news article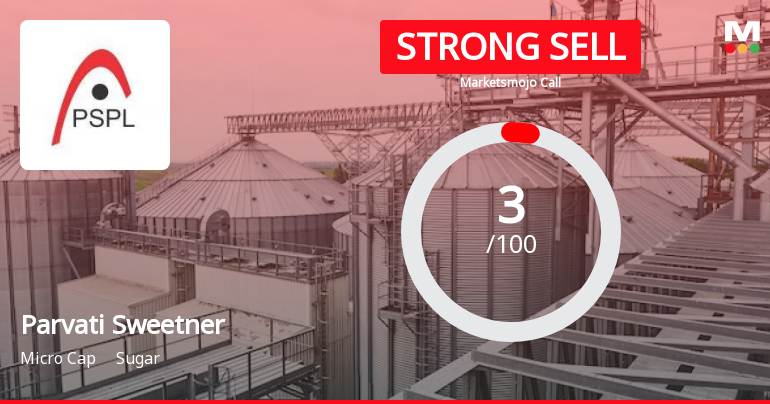
Parvati Sweetners and Power Ltd is Rated Strong Sell
Parvati Sweetners and Power Ltd is rated Strong Sell by MarketsMOJO, with this rating last updated on 08 May 2026. However, the analysis and financial metrics discussed here reflect the stock’s current position as of 08 July 2026, providing investors with the most recent and relevant data to assess the company’s outlook.
Read full news article
Parvati Sweetners and Power Ltd is Rated Strong Sell
Parvati Sweetners and Power Ltd is rated Strong Sell by MarketsMOJO, with this rating last updated on 08 May 2026. However, the analysis and financial metrics discussed here reflect the company’s current position as of 27 June 2026, providing investors with an up-to-date view of its fundamentals, valuation, financial trends, and technical outlook.
Read full news article Announcements
Compliances-Certificate under Reg. 74 (5) of SEBI (DP) Regulations 2018
14-Jul-2026 | Source : BSESubmission of Certificate U/R 74(5) of SEBI (DP) Regulations 2018 .
Closure of Trading Window
25-Jun-2026 | Source : BSESUBMISSION REGARDING CLOSURE OF TRADING WINDOW
Announcement under Regulation 30 (LODR)-Newspaper Publication
02-Jun-2026 | Source : BSESubmission of Newspaper Clipping.
Corporate Actions

No Upcoming Board Meetings

No Dividend history available

No Splits history available

No Bonus history available

Parvati Sweetners and Power Ltd has announced 17:26 rights issue, ex-date: 08 Feb 23
Quality key factors
Valuation key factors
Technicals key factors
 Technical Indicator Scale: Bearish, Mildly Bearish, Sideways, Mildly Bullish, Bullish Turned
 Shareholding Snapshot : Mar 2026
Shareholding Compare (%holding)
Promoters
None
Held by 0 Schemes
Held by 0 FIIs
Ananjay Construction And Contracts Private Limited (31.5%)
Vijay Suryawansi (5.36%)
29.1%
Quarterly Results Snapshot (Standalone) - Mar'26 - QoQ

QoQ Growth in quarter ended Mar 2026 is 25,000.00% vs -62.50% in Dec 2025
QoQ Growth in quarter ended Mar 2026 is 33.51% vs -12.01% in Dec 2025
Half Yearly Results Snapshot (Standalone) - Sep'25

Growth in half year ended Sep 2025 is -92.53% vs 12.16% in Sep 2024
Growth in half year ended Sep 2025 is -8,637.50% vs -77.78% in Sep 2024
Nine Monthly Results Snapshot (Standalone) - Dec'25
YoY Growth in nine months ended Dec 2025 is -93.07% vs -4.09% in Dec 2024
YoY Growth in nine months ended Dec 2025 is -738.10% vs -290.91% in Dec 2024
Annual Results Snapshot (Standalone) - Mar'26
YoY Growth in year ended Mar 2026 is -66.42% vs -33.52% in Mar 2025
YoY Growth in year ended Mar 2026 is -2,350.00% vs -59.44% in Mar 2025
About Parvati Sweetners and Power Ltd

Company Coordinates


