
Compare Parvati Sweetner with Similar Stocks
Dashboard
With a Operating Losses, the company has a Weak Long Term Fundamental Strength
- Company's ability to service its debt is weak with a poor EBIT to Interest (avg) ratio of -0.03
- The company has been able to generate a Return on Equity (avg) of 1.03% signifying low profitability per unit of shareholders funds
Negative results in Mar 26
Risky - Negative EBITDA
Below par performance in long term as well as near term
Stock DNA
Sugar
INR 104 Cr (Micro Cap)
NA (Loss Making)
19
0.00%
0.15
-14.68%
1.17
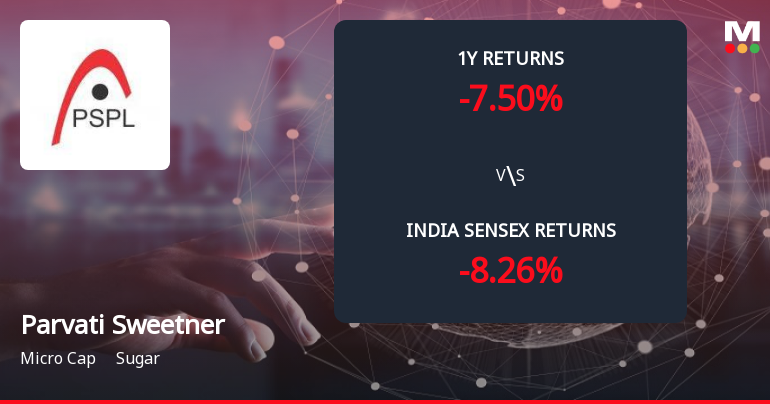
Total Returns (Price + Dividend) 
Parvati Sweetner for the last several years.
Risk Adjusted Returns v/s
Returns Beta

News
Parvati Sweetners and Power Ltd Forms Death Cross, Signalling Bearish Trend
Parvati Sweetners and Power Ltd has recently formed a Death Cross, a significant technical indicator where the 50-day moving average crosses below the 200-day moving average. This development signals a potential shift towards a bearish trend, reflecting deteriorating momentum and raising concerns about the stock’s medium to long-term outlook.
Read full news article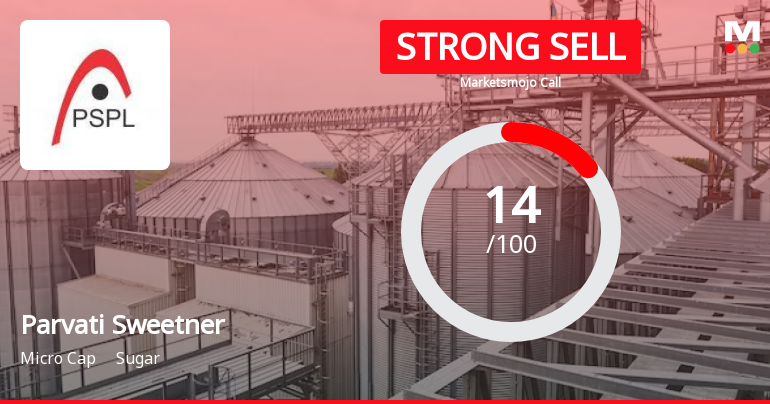
Parvati Sweetners and Power Ltd is Rated Strong Sell
Parvati Sweetners and Power Ltd is rated Strong Sell by MarketsMOJO. This rating was last updated on 08 May 2026, reflecting a significant reassessment of the stock’s outlook. However, all fundamentals, returns, and financial metrics discussed below are based on the company’s current position as of 02 June 2026, providing investors with the latest comprehensive view of the stock’s performance and prospects.
Read full news articleAre Parvati Sweetners and Power Ltd latest results good or bad?
Parvati Sweetners and Power Ltd's latest financial results for Q4 FY26 indicate a company facing significant operational challenges. The company reported net sales of ₹15.06 crores, reflecting a remarkable quarter-on-quarter growth of 25,000% compared to the previous quarter. However, this growth is overshadowed by a net loss of ₹2.48 crores, a stark contrast to the net profit of ₹1.84 crores recorded in the same quarter last year. This shift highlights a substantial deterioration in profitability. The operating margin for the quarter stood at negative 7.90%, indicating that the company is unable to generate positive operating profits, which is a critical concern for its financial health. Additionally, the return on equity (ROE) was negative at 9.18%, further underscoring the challenges the company faces in creating value for shareholders. The financial performance over the fiscal year also reveals a trou...
Read full news article Announcements
Announcement under Regulation 30 (LODR)-Newspaper Publication
02-Jun-2026 | Source : BSESubmission of Newspaper Clipping.
Board Meeting Outcome For Outcome Of 01/2026-27 Board Meeting Of The Company Held On May 30Th 2026 At The Registered Office Of The Company At 3:30 P.M.
30-May-2026 | Source : BSEOUTCOME OF BOARD MEETING.
Compliances-Reg.24(A)-Annual Secretarial Compliance
30-May-2026 | Source : BSESUBMISSION OF THE ANNUAL SECRETARIAL COMPLIANCE REPORT FOR THE FY 2025-26.
Corporate Actions

No Upcoming Board Meetings

No Dividend history available

No Splits history available

No Bonus history available

Parvati Sweetners and Power Ltd has announced 17:26 rights issue, ex-date: 08 Feb 23
Quality key factors
Valuation key factors
Technicals key factors
 Technical Indicator Scale: Bearish, Mildly Bearish, Sideways, Mildly Bullish, Bullish Turned
 Shareholding Snapshot : Mar 2026
Shareholding Compare (%holding)
Promoters
None
Held by 0 Schemes
Held by 0 FIIs
Ananjay Construction And Contracts Private Limited (31.5%)
Vijay Suryawansi (5.36%)
29.1%
Quarterly Results Snapshot (Standalone) - Mar'26 - QoQ

QoQ Growth in quarter ended Mar 2026 is 25,000.00% vs -62.50% in Dec 2025
QoQ Growth in quarter ended Mar 2026 is 33.51% vs -12.01% in Dec 2025
Half Yearly Results Snapshot (Standalone) - Sep'25

Growth in half year ended Sep 2025 is -92.53% vs 12.16% in Sep 2024
Growth in half year ended Sep 2025 is -8,637.50% vs -77.78% in Sep 2024
Nine Monthly Results Snapshot (Standalone) - Dec'25
YoY Growth in nine months ended Dec 2025 is -93.07% vs -4.09% in Dec 2024
YoY Growth in nine months ended Dec 2025 is -738.10% vs -290.91% in Dec 2024
Annual Results Snapshot (Standalone) - Mar'26
YoY Growth in year ended Mar 2026 is -66.42% vs -33.52% in Mar 2025
YoY Growth in year ended Mar 2026 is -2,350.00% vs -59.44% in Mar 2025
About Parvati Sweetners and Power Ltd

Company Coordinates


