
Compare Pasupati Acrylon with Similar Stocks
Dashboard
The company is Net-Debt Free
Poor long term growth as Net Sales has grown by an annual rate of 14.85% and Operating profit at 13.00% over the last 5 years
The company has declared Positive results for the last 3 consecutive quarters
With ROE of 18.4, it has a Expensive valuation with a 1.6 Price to Book Value
Despite the size of the company, domestic mutual funds hold only 0.59% of the company
Market Beating performance in long term as well as near term
Stock DNA
Petrochemicals
INR 594 Cr (Micro Cap)
8.00
23
0.00%
-0.01
18.41%
1.57
Total Returns (Price + Dividend) 
Pasupati Acrylon for the last several years.
Risk Adjusted Returns v/s
Returns Beta

News
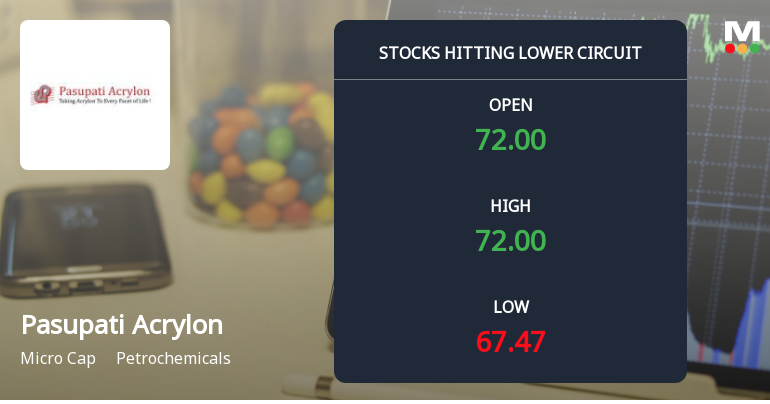
Pasupati Acrylon Ltd Locks at Lower Circuit With 5.0% Loss — Sellers Queue, No Buyers in Sight
At Rs 67.48, sellers were still queuing — but there were no buyers willing to take the other side. Pasupati Acrylon Ltd locked at its lower circuit of 5.0% on 11 Jun 2026, with unfilled sell orders and a frozen price, signalling a pronounced imbalance in supply and demand.
Read full news article
Pasupati Acrylon Ltd is Rated Hold
Pasupati Acrylon Ltd is rated 'Hold' by MarketsMOJO, with this rating last updated on 01 June 2026. However, the analysis and financial metrics discussed here reflect the stock's current position as of 09 June 2026, providing investors with the latest insights into its performance and outlook.
Read full news article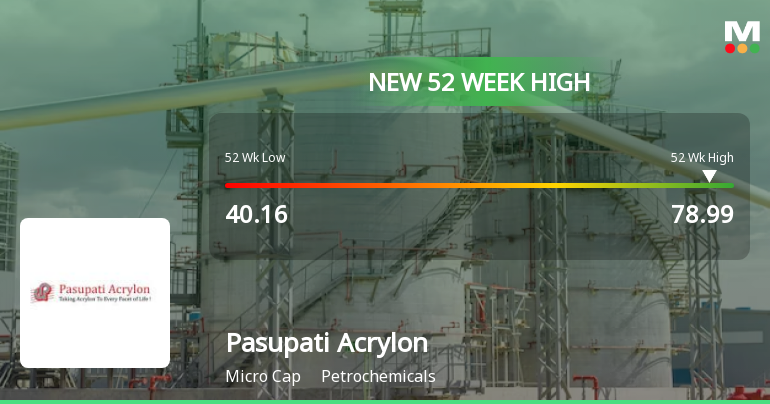
Broad-Based Technical Strength Lifts Pasupati Acrylon Ltd to 52-Week High of Rs 77.15
Surging past its previous peaks, Pasupati Acrylon Ltd touched a new 52-week high of Rs 77.15 on 8 Jun 2026, marking a remarkable 56.81% gain over the past year. This rally stands in stark contrast to the broader Sensex, which has declined by 10.26% over the same period, underscoring the stock’s exceptional momentum amid a challenging market backdrop.
Read full news article Announcements
Announcement under Regulation 30 (LODR)-Newspaper Publication
27-May-2026 | Source : BSEPlease find the copies of newspaper publication in respect of publication of financial results for the period ended 31st March 2026
Audited Financial Results For The Quarter & Year Ended 31St March 2026
25-May-2026 | Source : BSEPlease find the audited financial results for the period ended 31st March 2026 as approved by the Board of Directors at its meeting held on 25th May 2026.
Appointment Of Cost Auditor Of The Company For The Financial Year Ending 31St March 2027
25-May-2026 | Source : BSEPlease find the disclosure about appointment of cost auditor of the Company for the financial year ending 31st March 2027
Corporate Actions

No Upcoming Board Meetings

No Dividend history available

No Splits history available

No Bonus history available

No Rights history available
Quality key factors
Valuation key factors
Technicals key factors
 Technical Indicator Scale: Bearish, Mildly Bearish, Sideways, Mildly Bullish, Bullish Turned
 Shareholding Snapshot : Mar 2026
Shareholding Compare (%holding)
Promoters
None
Held by 7 Schemes (0.2%)
Held by 5 FIIs (0.47%)
Vineet Jain (18.91%)
Saturn Dess Private Limited (1.43%)
28.04%
Quarterly Results Snapshot (Standalone) - Mar'26 - QoQ

QoQ Growth in quarter ended Mar 2026 is -9.14% vs -3.93% in Dec 2025
QoQ Growth in quarter ended Mar 2026 is 2.30% vs 58.58% in Dec 2025
Half Yearly Results Snapshot (Standalone) - Sep'25

Growth in half year ended Sep 2025 is 77.73% vs 15.20% in Sep 2024
Growth in half year ended Sep 2025 is 28.40% vs 266.23% in Sep 2024
Nine Monthly Results Snapshot (Standalone) - Dec'25
YoY Growth in nine months ended Dec 2025 is 68.95% vs 13.72% in Dec 2024
YoY Growth in nine months ended Dec 2025 is 81.00% vs 3,445.59% in Dec 2024
Annual Results Snapshot (Standalone) - Mar'26
YoY Growth in year ended Mar 2026 is 62.55% vs 8.03% in Mar 2025
YoY Growth in year ended Mar 2026 is 97.63% vs 168.23% in Mar 2025
About Pasupati Acrylon Ltd

Company Coordinates


