
Compare Pasupati Fincap with Similar Stocks
Stock DNA
Non Banking Financial Company (NBFC)
INR 5 Cr (Micro Cap)
NA (Loss Making)
9
0.00%
-0.86
30.00%
-5.16
Total Returns (Price + Dividend) 
Pasupati Fincap for the last several years.
Risk Adjusted Returns v/s
Returns Beta

News
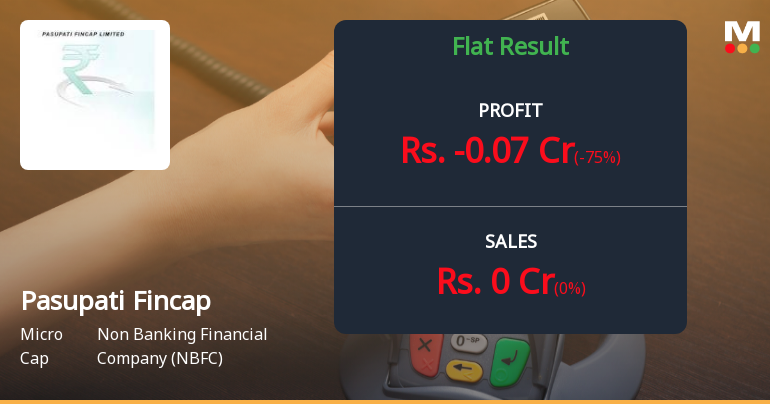
Pasupati Fincap Q4 FY26: Deepening Losses Signal Existential Crisis for Micro-Cap NBFC
Pasupati Fincap Ltd., a micro-cap non-banking financial company, reported a net loss of ₹0.07 crores for Q4 FY26, marking yet another quarter of uninterrupted losses for the beleaguered NBFC. The stock plunged 5.00% to ₹10.46 following the results, reflecting investor dismay over the company's inability to generate meaningful revenue or stem the haemorrhaging of shareholder value. With a market capitalisation of just ₹5.00 crores and a negative book value of ₹1.27 per share, Pasupati Fincap remains in a precarious financial position that raises serious questions about its viability as a going concern.
Read full news articleWhen is the next results date for Pasupati Fincap Ltd?
The next results date for Pasupati Fincap Ltd is scheduled for 30 May 2026....
Read full news article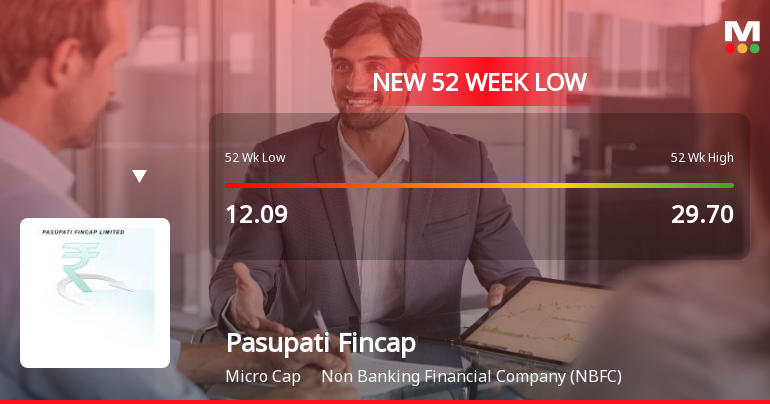
Five Consecutive Losses Push Pasupati Fincap Ltd to a New 52-Week Low
For the fifth straight session, Pasupati Fincap Ltd closed lower, breaching its 52-week low at Rs 9.09 on 16 Apr 2026. This marks a sharp 22.37% decline over the past five days, extending the stock’s downward trajectory amid a broader market that is showing resilience.
Read full news article Announcements
Announcement under Regulation 30 (LODR)-Newspaper Publication
02-Jun-2026 | Source : BSENewspaper Publication for Financial Results.
Board Meeting Outcome for The Standalone Audited Financials Statements For The Quarter And Year Ended 31St March 2026
30-May-2026 | Source : BSEthe Standalone audited financials statements for the quarter and year ended 31st March 2026
Results For The Quarter And Financial Year Ended 31St March 2026.
30-May-2026 | Source : BSEResults For The Quarter And Financial Year Ended 31st March 2026.
Corporate Actions

No Upcoming Board Meetings

No Dividend history available

No Splits history available

No Bonus history available

No Rights history available
Quality key factors
Valuation key factors
Technicals key factors
 Technical Indicator Scale: Bearish, Mildly Bearish, Sideways, Mildly Bullish, Bullish Turned
 Shareholding Snapshot : Mar 2026
Shareholding Compare (%holding)
Non Institution
None
Held by 0 Schemes
Held by 0 FIIs
Dinesh Pareekh (11.55%)
Orion Investmart Private Limited (7.97%)
59.84%
Quarterly Results Snapshot (Standalone) - Mar'26 - YoY
YoY Growth in quarter ended Mar 2026 is 0.00% vs 0.00% in Mar 2025

YoY Growth in quarter ended Mar 2026 is -75.00% vs 33.33% in Mar 2025
Half Yearly Results Snapshot (Standalone) - Sep'25

Growth in half year ended Sep 2025 is 0.00% vs -100.00% in Sep 2024
Growth in half year ended Sep 2025 is 53.33% vs -900.00% in Sep 2024
Nine Monthly Results Snapshot (Standalone) - Dec'25
YoY Growth in nine months ended Dec 2025 is 0.00% vs -100.00% in Dec 2024
YoY Growth in nine months ended Dec 2025 is 31.25% vs -433.33% in Dec 2024
Annual Results Snapshot (Standalone) - Mar'26
YoY Growth in year ended Mar 2026 is 0.00% vs -100.00% in Mar 2025
YoY Growth in year ended Mar 2026 is 14.29% vs -191.67% in Mar 2025
About Pasupati Fincap Ltd

Company Coordinates


