
Compare Patanjali Foods with Similar Stocks
Dashboard
With ROCE of 10, it has a Expensive valuation with a 3.1 Enterprise value to Capital Employed
- The stock is trading at a premium compared to its peers' average historical valuations
- Over the past year, while the stock has generated a return of -22.10%, its profits have risen by 54.8% ; the PEG ratio of the company is 0.4
38.1% of Promoter Shares are Pledged
Below par performance in long term as well as near term
Stock DNA
Edible Oil
INR 45,429 Cr (Mid Cap)
22.00
46
0.99%
0.15
15.38%
3.47
Total Returns (Price + Dividend) 
Latest dividend: 1.7415037269093656 per share ex-dividend date: Apr-24-2026
Risk Adjusted Returns v/s
Returns Beta

News
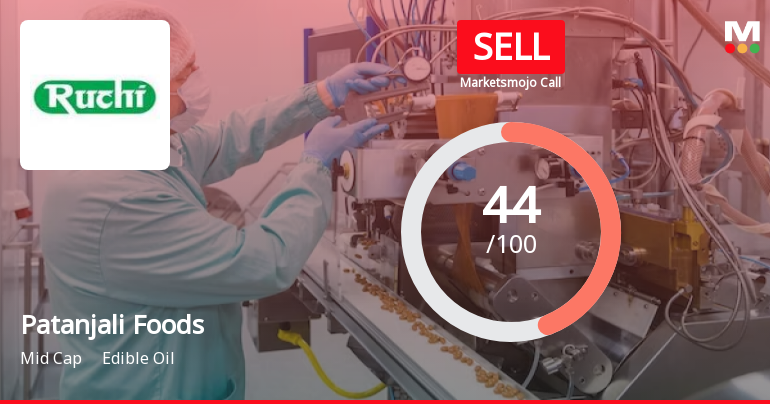
Patanjali Foods Ltd is Rated Sell
Patanjali Foods Ltd is rated 'Sell' by MarketsMOJO, with this rating last updated on 08 June 2026. However, the analysis and financial metrics discussed here reflect the stock's current position as of 20 June 2026, providing investors with an up-to-date view of the company’s performance and outlook.
Read full news article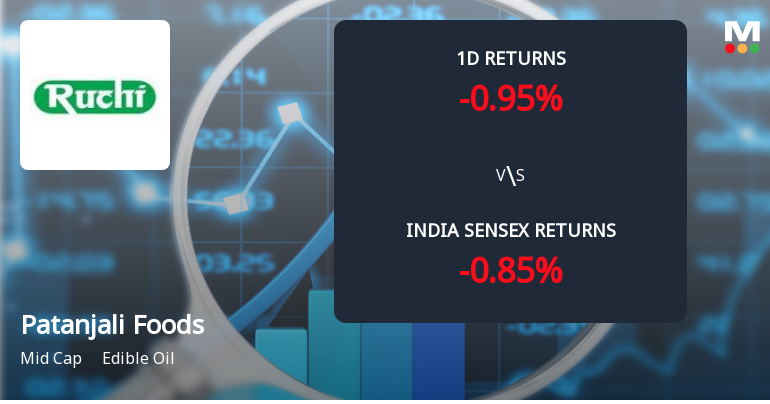
Patanjali Foods Sees Sharp Open Interest Surge Amid Bearish Market Signals
Patanjali Foods Ltd, a mid-cap player in the edible oil sector, has witnessed a notable 11.04% surge in open interest (OI) in its derivatives segment, signalling heightened market activity despite the stock trading near its 52-week low. This development comes amid falling investor participation and a downgrade in the company’s mojo grade, raising questions about the underlying market sentiment and potential directional bets by traders.
Read full news article
Patanjali Foods Sees Sharp Open Interest Surge Amid Bearish Market Signals
Patanjali Foods Ltd, a mid-cap player in the edible oil sector, has witnessed a notable 10.8% surge in open interest in its derivatives segment, signalling heightened market activity despite the stock trading near its 52-week low. This increase in open interest, coupled with subdued investor participation and a downgrade in its Mojo Grade to Sell, paints a complex picture of market positioning and potential directional bets among traders.
Read full news article Announcements
Disclosure Under Regulation 30 Of Securities And Exchange Board Of India (Listing Obligations And Disclosure Requirements) Regulations 2015.
21-Jun-2026 | Source : BSEDisclosure under Regulation 30 of Securities and Exchange Board of India (Listing Obligations and Disclosure Requirements) Regulations 2015.
Intimation Under Regulation 30 Of SEBI (Listing Obligations And Disclosure Requirements) Regulations 2015 - Investment Through Rights Issue In Contemporary Agro Private Limited Wholly Owned Subsidiary Of The Company.
19-Jun-2026 | Source : BSEPursuant to Regulation 30(6) Para A(1) Part A of Schedule III read with SEBI Master Circular dated January 30 2026 we hereby inform you that the Company had made further investment in Contemporary Agro Private Limited a wholly owned subsidiary of the Company by way of subscribing 5000000 Zero Percent Redeemable Preference Share of Rs. 10/- each through right basis
Disclosure Under Regulation 30 Of Securities And Exchange Board Of India (Listing Obligations And Disclosure Requirements) Regulations 2015- Update On GST Proceedings - Demand Proceedings Dropped.
13-Jun-2026 | Source : BSEDisclosure under Regulation 30 of Securities and Exchange Board of India(Listing Obligations and Disclosure Requirements) Regulations 2015.
Corporate Actions

No Upcoming Board Meetings

Patanjali Foods Ltd has declared 87% dividend, ex-date: 24 Apr 26

Patanjali Foods Ltd has announced 2:10 stock split, ex-date: 29 Oct 07

Patanjali Foods Ltd has announced 2:1 bonus issue, ex-date: 11 Sep 25

No Rights history available
Quality key factors
Valuation key factors
Technicals key factors
 Technical Indicator Scale: Bearish, Mildly Bearish, Sideways, Mildly Bullish, Bullish Turned
 Shareholding Snapshot : Mar 2026
Shareholding Compare (%holding)
Promoters
38.0979
Held by 31 Schemes (2.25%)
Held by 130 FIIs (9.2%)
Patanjali Ayurved Limited (29.61%)
Life Insurance Corporation Of India (9.13%)
7.02%
Quarterly Results Snapshot (Standalone) - Mar'26 - QoQ

QoQ Growth in quarter ended Mar 2026 is 6.41% vs 7.23% in Dec 2025
QoQ Growth in quarter ended Mar 2026 is -11.75% vs 14.91% in Dec 2025
Half Yearly Results Snapshot (Standalone) - Sep'25

Growth in half year ended Sep 2025 is 21.73% vs -2.17% in Sep 2024
Growth in half year ended Sep 2025 is 21.90% vs 67.07% in Sep 2024
Nine Monthly Results Snapshot (Standalone) - Dec'25
YoY Growth in nine months ended Dec 2025 is 19.80% vs 3.18% in Dec 2024
YoY Growth in nine months ended Dec 2025 is 36.92% vs 68.71% in Dec 2024
Annual Results Snapshot (Consolidated) - Mar'26
Not Applicable: The company has declared_date for only one period
Not Applicable: The company has declared_date for only one period
About Patanjali Foods Ltd

Company Coordinates


