
Dashboard
With ROE of 6.8, it has a Very Expensive valuation with a 10 Price to Book Value
- The stock is trading at a discount compared to its peers' average historical valuations
- Over the past year, while the stock has generated a return of -11.11%, its profits have risen by 178.4% ; the PEG ratio of the company is 0.7
Stock DNA
Financial Technology (Fintech)
INR 68,088 Cr (Mid Cap)
117.00
20
0.00%
0.05
6.82%
10.02
Total Returns (Price + Dividend) 
PB Fintech. for the last several years.
Risk Adjusted Returns v/s
Returns Beta

News
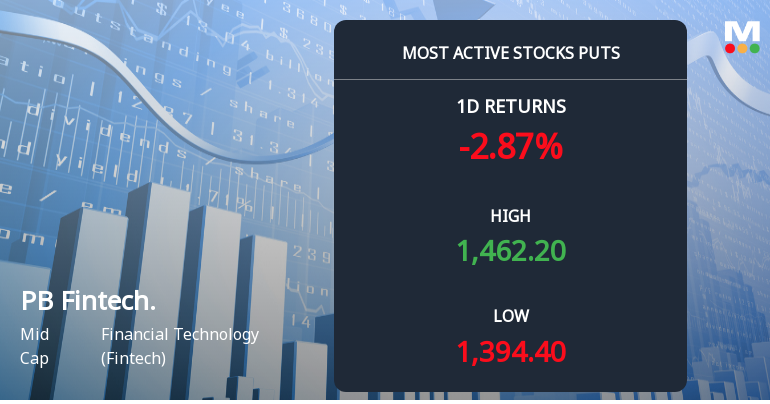
Rs 1,400 Puts — 1.6% Below Current Price — Draw 4,462 Contracts on PB Fintech Ltd
The stock is trading near its 52-week low, yet 4,462 put contracts at the Rs 1,400 strike have changed hands on PB Fintech Ltd, signalling a nuanced options market dynamic rather than straightforward bearishness.
Read full news article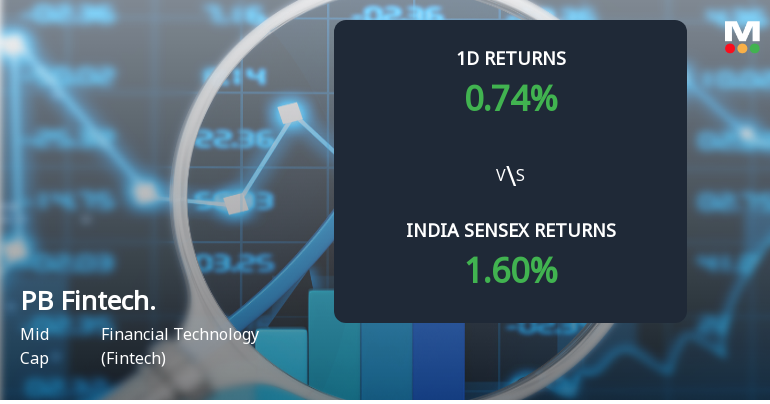
PB Fintech Ltd Sees Sharp Open Interest Surge Amid Mixed Market Signals
PB Fintech Ltd (POLICYBZR) has witnessed a notable 13.9% increase in open interest in its derivatives segment, signalling heightened market activity and shifting investor positioning. Despite a modest 0.65% gain in the stock price, the surge in open interest contrasts with subdued delivery volumes and underperformance relative to its sector, raising questions about the underlying directional bets and market sentiment.
Read full news article
PB Fintech Ltd Sees Significant Open Interest Surge Amid Mixed Market Signals
PB Fintech Ltd (POLICYBZR) has witnessed a notable 12.74% increase in open interest in its derivatives segment, signalling heightened market activity and shifting investor positioning. Despite a modest 1.42% gain in the stock price, the surge in open interest and volume patterns suggest evolving directional bets amid a broader sector rally and subdued investor participation.
Read full news article Announcements
Announcement under Regulation 30 (LODR)-Analyst / Investor Meet - Intimation
11-Mar-2026 | Source : BSEIntimation of Schedule of Analyst/ Investor Meet on March 17 2026
Announcement under Regulation 30 (LODR)-Analyst / Investor Meet - Intimation
09-Mar-2026 | Source : BSEIntimation of Schedule of Analyst/ Investor Meet on March 13 2026
Update On Incorporation Of The Step Down Subsidiaryon Of Step-Down Subsidiary
27-Feb-2026 | Source : BSEUpdate on incorporation of the step-down subsidiary of the Company
Corporate Actions

No Upcoming Board Meetings

No Dividend history available

No Splits history available

No Bonus history available

No Rights history available
Quality key factors
Valuation key factors
Technicals key factors
 Technical Indicator Scale: Bearish, Mildly Bearish, Sideways, Mildly Bullish, Bullish Turned
 Shareholding Snapshot : Dec 2025
Shareholding Compare (%holding)
FIIs
None
Held by 36 Schemes (20.21%)
Held by 822 FIIs (40.77%)
None
Makesense Technologies Limited (12.94%)
4.09%
Quarterly Results Snapshot (Consolidated) - Dec'25 - QoQ

QoQ Growth in quarter ended Dec 2025 is 9.77% vs 19.70% in Sep 2025
QoQ Growth in quarter ended Dec 2025 is 40.43% vs 59.41% in Sep 2025
About PB Fintech Ltd

Company Coordinates


