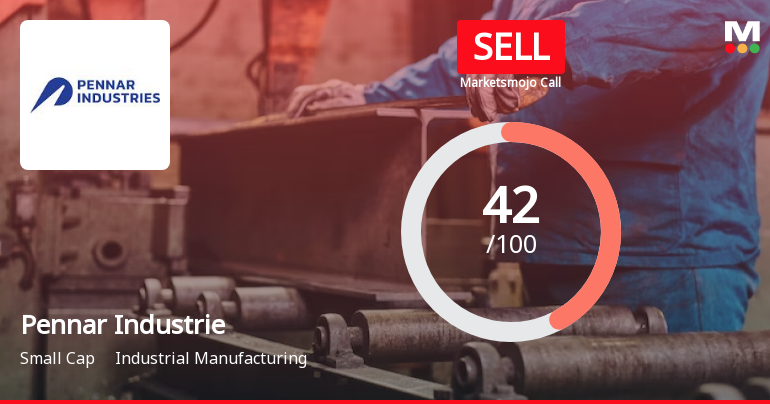
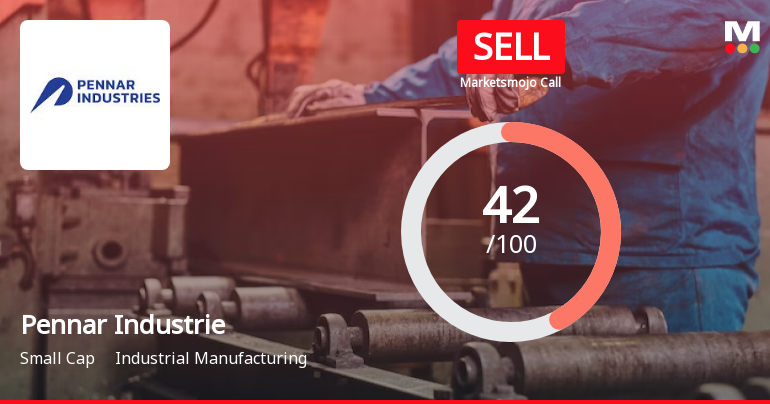
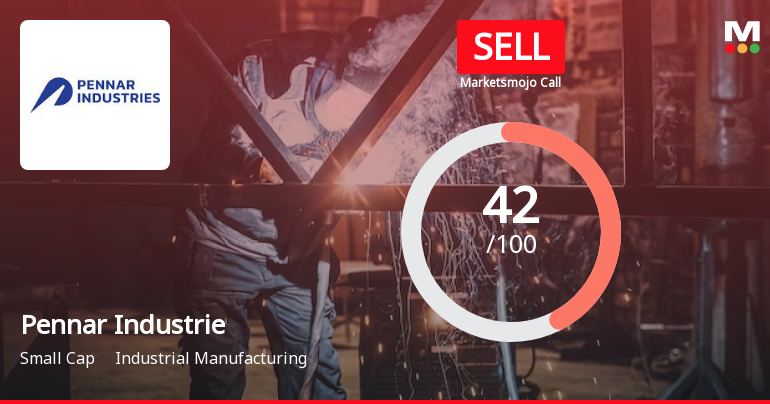
Pennar Industrie

  • Market Cap: Small Cap
  • Industry: Industrial Manufacturing
  • ISIN: INE932A01024
  • NSEID: PENIND
  • BSEID: 513228
INR
174.65
3.9 (2.28%)
BSENSE

Sep 22, 09:39 AM

BSE+NSE Vol: 27.05 k

  • Price Points
  • Score
  • Mojo Parameters
  • Total Return
  • News and Corporate Actions
  • Key factors
  • Shareholding
  • Financials
  • CompanyCV
stock-summaryPrice Point
High/Low

1Day

52 Week

Valuation
Technical
Day's Volume

CASH

27.05 k (-4.87%) Volume

Shareholding (Jun 2026)

FII

3.99%

Held by 45 FIIs

DII

5.90%

Held by 7 DIIs

Promoter

39.67%

Which are the latest news on Pennar Industrie?

21-Sep-2026

Why is Pennar Industries Ltd falling/rising?

06-Sep-2026

As of 05-Sep, Pennar Industries Ltd's stock price is rising to Rs 169.60, up 1.68%, supported by strong recent performance and increased institutional investment. Despite a year-to-date decline of -16.94% and challenges in debt servicing, the stock's current valuation may attract investors.

As of 05-Sep, Pennar Industries Ltd's stock price is rising, currently at Rs 169.60, reflecting a change of Rs 2.8 or 1.68% increase. This upward movement is supported by several factors. Over the past week, the stock has outperformed the Sensex, gaining 4.37% compared to the index's decline of 0.97%. Additionally, today the stock reached an intraday high of Rs 171.05, marking a 2.55% increase.<BR><BR>The stock's performance today has also been noted to outperform its sector by 0.9%. Furthermore, despite a significant drop in year-to-date performance of -16.94%, the company's profits have increased by 14% over the past year, indicating a potential for recovery. The stock is currently trading at a discount compared to its peers' average historical valuations, which may attract investors looking for value.<BR><BR>Moreover, there has been an increase in participation by institutional investors, who have raised their stake by 0.57% in the previous quarter, now holding 9.89% of the company. This suggests a growing confidence among more knowledgeable investors regarding the company's fundamentals.<BR><BR>However, it is important to note that the stock has experienced a decline of -30.89% over the past year and faces challenges such as a weak EBIT to Interest ratio of 1.81, indicating difficulties in servicing its debt. Despite these concerns, the recent positive performance metrics and institutional interest may be contributing to the current rise in stock price.

View full answer

Who are in the management team of Pennar Industrie?

01-Sep-2026

The management team of Pennar Industrie includes Executive Chairman Nrupender Rao, Vice Chairman & Managing Director Aditya N Rao, Executive Director K Lavanya Kumar, and Company Secretary Mirza Mohammed Ali Baig, along with several non-executive and independent directors. This team is responsible for guiding the company's strategy and operations.

The management team of Pennar Industrie includes the following key individuals:<BR><BR>1. **Nrupender Rao** - Executive Chairman<BR>2. **Aditya N Rao** - Vice Chairman & Managing Director<BR>3. **K Lavanya Kumar** - Executive Director<BR>4. **Mirza Mohammed Ali Baig** - Company Secretary & Compliance Officer<BR><BR>Additionally, the board features several non-executive and independent directors:<BR><BR>- **B Kamalaker Rao** - Non-Executive & Independent Director<BR>- **Manish Sabharwal** - Non-Executive & Independent Director<BR>- **Chandrasekhar Sripada** - Non-Executive & Independent Director<BR>- **Ravi Venkata Siva Ramakrishna** - Independent Director<BR>- **P V Rao** - Director<BR>- **Eric James Brown** - Director<BR><BR>This team plays a crucial role in guiding the company's strategy and operations.

View full answer

What does Pennar Industrie do?

01-Sep-2026

Pennar Industries Ltd is an Indian engineering company specializing in engineered products for the industrial manufacturing sector, with a market cap of INR 2,223 Cr and reported net sales of 870 Cr and net profit of 35 Cr for June 2026. Founded in 1975, it has a P/E ratio of 16.00 and a debt-equity ratio of 0.77.

Overview:<BR>Pennar Industries Ltd is a leading engineering organization in India, specializing in providing engineered products and solutions within the industrial manufacturing sector and classified as a small-cap company.<BR><BR>History:<BR>Incorporated in August 1975, Pennar Industries was formerly known as Pennar Steels Ltd. The latest quarterly results reported net sales and profit for June 2026.<BR><BR>Financial Snapshot:<BR>Net Sales: 870 Cr (Quarterly Results - Jun 2026) <BR>Net Profit: 35 Cr (Quarterly Results - Jun 2026) <BR>Market Cap: INR 2,223 Cr (Small Cap)<BR><BR>Key Metrics:<BR>P/E: 16.00 <BR>Industry P/E: 25 <BR>Dividend Yield: 0.00% <BR>Debt-Equity: 0.77 <BR>Return on Equity: 11.93% <BR>Price to Book: 1.89 <BR><BR>Contact Details:<BR>Address: Floor No 3 DHFLVC, Silicon Towers Kondapur Hyderabad Telangana : 500084 <BR>Tel: 91-40-23117043/7045/23114072 <BR>Email: corporatecommunications@pennarindia <BR>Website: http://www.pennarindia.com

View full answer

Who are the peers of the Pennar Industrie?

01-Sep-2026

Pennar Industrie's peers include Kilburn Engg., HMT, HLE Glascoat, Honda India, and others. While Kilburn Engg. shows excellent management and growth, Pennar Industrie has below-average growth and capital structure, with a 1-year return of -30.45%.

Peers: The peers of Pennar Industrie are Kilburn Engg., HMT, HLE Glascoat, Honda India, Kabra Extrusion, Indian Hume Pipe, OBSC Perfection, Thejo Engg., Vinyas Innovativ, and Macpower CNC.<BR><BR>Quality Snapshot: Excellent management risk is observed at Honda India and OBSC Perfection, while Average management risk is found at Kilburn Engg., Pennar Industrie, Kabra Extrusion, Indian Hume Pipe, Thejo Engg., Vinyas Innovativ, and Macpower CNC, and the rest. Good growth is seen at Kilburn Engg., while Below Average growth is noted at Pennar Industrie, HLE Glascoat, Honda India, Kabra Extrusion, Indian Hume Pipe, Thejo Engg., and the rest. Excellent capital structure is present at Kilburn Engg., Honda India, Thejo Engg., and the rest, while Below Average capital structure is found at Pennar Industrie, and Average capital structure is observed at HLE Glascoat, Kabra Extrusion, Indian Hume Pipe, Vinyas Innovativ, and Macpower CNC.<BR><BR>Return Snapshot: Kabra Extrusion has the highest 1-year return at 107.95%, while HLE Glascoat has the lowest at -40.38%, with Pennar Industrie’s own 1-year return at -30.45%, indicating it is better than HLE Glascoat but worse than Kabra Extrusion. Additionally, HLE Glascoat, Honda India, and Pennar Industrie have negative six-month returns.

View full answer

How big is Pennar Industrie?

01-Sep-2026

As of 31st August, Pennar Industries Ltd has a market capitalization of 2,223.00 Cr, with net sales of 3,644.84 Cr and a net profit of 142.28 Cr reported in the latest four quarters. Shareholder's funds were 998.45 Cr and total assets were valued at 2,953.27 Cr as of March 2025.

As of 31st August, Pennar Industries Ltd has a market capitalization of 2,223.00 Cr, categorizing it as a Small Cap company.<BR><BR>In the latest four quarters, Pennar Industries reported net sales of 3,644.84 Cr and a net profit of 142.28 Cr.<BR><BR>The latest annual period for the balance sheet is March 2025, where shareholder's funds amounted to 998.45 Cr and total assets were valued at 2,953.27 Cr.

View full answer

Should I buy, sell or hold Pennar Industries Ltd?

15-Aug-2026

When is the next results date for Pennar Industries Ltd?

05-Aug-2026

The next results date for Pennar Industries Ltd is 12 August 2026.

The next results date for Pennar Industries Ltd is scheduled for 12 August 2026.

View full answer

Are Pennar Industries Ltd latest results good or bad?

28-May-2026

Pennar Industries Ltd's latest results are generally positive, with a 22.32% increase in net profit and improved operating margins at 11.37%. However, revenue declined slightly, indicating some challenges, and the stock has underperformed compared to its sector over the past year.

The latest results for Pennar Industries Ltd show a mixed but generally positive performance. In the fourth quarter of FY26, the company reported a net profit of ₹41.04 crore, which represents a 22.32% increase compared to the previous quarter and a 15.38% increase year-on-year. This growth in net profit is a strong indicator of the company's ability to enhance its profitability.<BR><BR>Operating margins also improved significantly, reaching 11.37%, the highest in the last seven quarters. This reflects effective cost management and operational efficiency, even though revenue saw a slight decline of 1.94% sequentially to ₹924.80 crore. Year-on-year, revenue growth was modest at 2.10%, indicating some challenges in the demand environment.<BR><BR>Overall, while the company has demonstrated strong profitability metrics and operational improvements, it has faced challenges with revenue growth, which has slowed down compared to previous years. Additionally, the stock has underperformed compared to its sector over the past year, which may raise concerns among investors. However, the positive trends in profit and margins suggest that there are strengths in the company's operational capabilities.

View full answer

Is Pennar Industrie technically bullish or bearish?

02-Dec-2025

As of December 1, 2025, Pennar Industrie is in a sideways trend with mixed technical indicators, showing mild bearishness on MACD and Bollinger Bands, while daily moving averages suggest a slight bullishness, indicating no clear direction.

As of 1 December 2025, the technical trend for Pennar Industrie has changed from mildly bullish to sideways. The current stance is neutral, with key indicators reflecting mixed signals. The MACD is mildly bearish on both weekly and monthly time frames, while the Bollinger Bands show a bearish signal on the weekly and a mildly bullish signal on the monthly. The moving averages indicate a mildly bullish trend on the daily, but both KST and Dow Theory show no trend on the weekly and monthly. Overall, the lack of strong directional indicators suggests a sideways movement with no clear bullish or bearish strength.

View full answer

How has been the historical performance of Pennar Industrie?

12-Nov-2025

Pennar Industrie has shown consistent growth from March 2022 to March 2025, with net sales increasing from 2,265.75 Crores to 3,226.58 Crores, and profit after tax rising from 41.91 Crores to 120.00 Crores. The company has also improved its operating profit and cash flow, indicating strong financial performance.

Answer:<BR>The historical performance of Pennar Industrie shows a consistent growth trajectory in net sales and profits over the years, culminating in the latest figures for March 2025.<BR><BR>Breakdown:<BR>Pennar Industrie has demonstrated significant growth in net sales, increasing from 2,265.75 Crores in March 2022 to 3,226.58 Crores in March 2025. This upward trend is reflected in the total operating income, which also rose from 2,265.75 Crores to 3,226.58 Crores during the same period. The company's operating profit (PBDIT) has improved from 188.42 Crores in March 2022 to 347.44 Crores in March 2025, indicating enhanced operational efficiency. Profit before tax has similarly increased from 55.91 Crores to 158.95 Crores, while profit after tax reached 120.00 Crores in March 2025, up from 41.91 Crores in March 2022. The company's total assets have expanded from 2,141.03 Crores in March 2022 to 2,953.27 Crores in March 2025, alongside total liabilities which grew from 2,141.03 Crores to 2,953.27 Crores. Cash flow from operating activities has also seen improvement, rising from 194.00 Crores in March 2022 to 255.00 Crores in March 2025, contributing to a net cash inflow of 51.00 Crores in the latest year. Overall, Pennar Industrie has shown a robust financial performance with increasing revenues, profits, and asset growth over the years.

View full answer

Is Pennar Industrie overvalued or undervalued?

27-Oct-2025

As of October 24, 2025, Pennar Industrie is considered overvalued with a PE ratio of 27.55 and an EV to EBITDA of 12.50, despite strong performance, as it is priced higher relative to its earnings growth potential compared to peers like JSW Steel and Tata Steel.

As of 24 October 2025, the valuation grade for Pennar Industrie has moved from fair to expensive, indicating a shift in perception regarding its market value. The company is currently considered overvalued. Key ratios include a PE ratio of 27.55, an EV to EBITDA of 12.50, and a PEG ratio of 1.30, which suggest that the stock is priced higher relative to its earnings growth potential compared to its peers.<BR><BR>In comparison to its industry peers, Pennar Industrie’s PE ratio is notably lower than that of JSW Steel at 45.42 and Tata Steel at 44.89, both of which are rated as fair. Additionally, Jindal Steel, with a PE of 24.44, also reflects a more attractive valuation. Despite recent strong performance, with a year-to-date return of 31.67% compared to the Sensex's 7.77%, the current valuation metrics suggest that investors may be paying a premium for Pennar Industrie, reinforcing the conclusion of overvaluation.

View full answer

Who are the top shareholders of the Pennar Industrie?

06-Jun-2025

The top shareholders of Pennar Industrie include Pennar Holdings Private Limited with 15.57%, individual investors with 42.6%, Southend Securities Private Limited at 1.55%, and 52 foreign institutional investors holding 3.81%. Currently, no mutual funds hold shares in the company.

The top shareholders of Pennar Industrie include Pennar Holdings Private Limited, which holds the highest stake at 15.57%. Additionally, individual investors collectively own 42.6% of the company. Other notable shareholders include Southend Securities Private Limited, with a holding of 1.55%, and 52 foreign institutional investors (FIIs) who together hold 3.81%. It's also worth noting that there are no mutual funds currently holding shares in the company.

View full answer

Has Pennar Industrie declared dividend?

06-Jun-2025

Yes, Pennar Industries Ltd has declared a 20% dividend, amounting to ₹1 per share, but the dividend yield is 0%. Total returns over various periods have been driven primarily by price appreciation, with significant growth observed.

Pennar Industries Ltd has declared a 20% dividend.<BR><BR>Dividend Details:<BR>- Percentage announced: 20%<BR>- Amount per share: 1<BR>- Ex-date: 19 Jul 13<BR><BR>Dividend Yield: 0%<BR><BR>Total Returns by Period:<BR>In the 6-month period, the price return was 12.07%, the dividend return was 0%, resulting in a total return of 12.07%.<BR><BR>For the 1-year period, the price return was 72.22%, the dividend return was 0%, leading to a total return of 72.22%.<BR><BR>Over the 2-year period, the price return was 220.55%, with a dividend return of 0%, culminating in a total return of 220.55%.<BR><BR>In the 3-year period, the price return reached 557.05%, while the dividend return remained at 0%, resulting in a total return of 557.05%.<BR><BR>During the 4-year period, the price return was 839.35%, with a dividend return of 0%, giving a total return of 839.35%.<BR><BR>Finally, in the 5-year period, the price return was 1409.16%, the dividend return was 0%, leading to a total return of 1409.16%.<BR><BR>Overall, while Pennar Industries Ltd has declared a dividend, the dividend yield remains at 0%, indicating that the returns have been primarily driven by price appreciation rather than dividends. The total returns over various periods show significant growth, highlighting the company’s strong performance in terms of price returns.

View full answer
iScoreScore
Click here to find our call on this stock
Strong Sell
Sell
Hold
Buy
Strong Buy

Dashboard

1

Company's ability to service its debt is weak with a poor EBIT to Interest (avg) ratio of 1.81

  • Company's ability to service its debt is weak with a poor EBIT to Interest (avg) ratio of 1.81
2

Poor long term growth as Net Sales has grown by an annual rate of 14.56% over the last 5 years

 
3

Flat results in Jun 26

stock-summaryMojo Parameters

Mojo Parameters

Loading Valuation Snapshot...

Stock DNA

stock-summary
Industry

Industrial Manufacturing

stock-summary
Market cap

INR 2,366 Cr (Small Cap)

stock-summary
P/E

16.00

stock-summary
Industry P/E

24

stock-summary
Dividend Yield

0.00%

stock-summary
Debt Equity

0.77

stock-summary
Return on Equity

11.93%

stock-summary
Price to Book

1.99

Revenue and Profits:
Net Sales:
870 Cr
(Quarterly Results - Jun 2026)
Net Profit:
35 Cr
stock-summaryTotal Returns
Total Returns (Price + Dividend) stock-summary
Dividend Yield (0%)
TimePeriod
Price Return
Dividend Return
Total Return
3 Months
5.72%
0%
5.72%
6 Months
22.22%
0%
22.22%
1 Year
-28.92%
0%
-28.92%
2 Years
2.92%
0%
2.92%
3 Years
57.98%
0%
57.98%
4 Years
263.48%
0%
263.48%
5 Years
502.24%
0%
502.24%

Latest dividend: 1 per share ex-dividend date: Jul-19-2013

Risk Adjusted Returns v/s stock-summary
Returns Beta
Icon
Beta has not been calculated since enough price history is not available
stock-summaryNews & Corporate Actions

Announcements stock-summary

Announcement under Regulation 30 (LODR)-Newspaper Publication

03-Sep-2026 | Source : BSE

Publication of Newspaper Advertisement

Notice For 50Th AGM Of The Company To Be Held On 24Th September 2026

02-Sep-2026 | Source : BSE

Notice for 50th AGM of the Company to be held on 24th September 2026

Business Responsibility And Sustainability Report For The Financial Year 2025-26

02-Sep-2026 | Source : BSE

Business Responsiblity and Sustainability Report for the Financial Year 2025-26

Corporate Actions stock-summary

stock-summary
BOARD MEETING

No Upcoming Board Meetings

stock-summary
DIVIDEND

Pennar Industries Ltd has declared 20% dividend, ex-date: 19 Jul 13

stock-summary
SPLITS

No Splits history available

stock-summary
BONUS

No Bonus history available

stock-summary
RIGHTS

No Rights history available

stock-summaryKey Factors

Quality key factors stock-summary

Factor
Value
Sales Growth (5y)
14.56%
EBIT Growth (5y)
22.82%
EBIT to Interest (avg)
1.81
Debt to EBITDA (avg)
3.25
Net Debt to Equity (avg)
0.77
Sales to Capital Employed (avg)
1.75
Tax Ratio
23.40%
Dividend Payout Ratio
0
Pledged Shares
8.73%
Institutional Holding
9.89%
ROCE (avg)
12.22%
ROE (avg)
10.10%

Valuation key factors

Factor
Value
P/E Ratio
16
Industry P/E
24
Price to Book Value
1.99
EV to EBIT
11.73
EV to EBITDA
8.84
EV to Capital Employed
1.56
EV to Sales
0.88
PEG Ratio
1.20
Dividend Yield
NA
ROCE (Latest)
13.19%
ROE (Latest)
11.93%

Technicals key factors

Indicator
Weekly
Monthly
MACD
Mildly Bullish
Mildly Bearish
RSI
No Signal
No Signal
Bollinger Bands
Mildly Bullish
Mildly Bearish
Moving Averages
Mildly Bearish (Daily)
KST
Bullish
Bearish
Dow Theory
No Trend
Mildly Bearish
OBV
No Trend
Mildly Bullish
stock-summary Technical Indicator Scale: Bearish, Mildly Bearish, Sideways, Mildly Bullish, Bullish  Turned 
stock-summaryShareholding
Shareholding Snapshot : Jun 2026stock-summary
Shareholding Compare (%holding) stock-summary
Majority shareholders

Non Institution

Pledged Promoter Holdings

8.7293

Mutual Funds

Held by 4 Schemes (5.73%)

FIIs

Held by 45 FIIs (3.99%)

Promoter with highest holding

Pennar Holdings Private Limited (15.57%)

Highest Public shareholder

Bandhan Small Cap Fund (4.5%)

Individual Investors Holdings

39.24%

stock-summaryFinancial
[
  {
    "link": "quarterly",
    "btn_text": "All Quarterly Results",
    "header": "Quarterly Results Snapshot (Consolidated) - Jun'26 - YoY",
    "rhs": [
      {
        "prefix": "Net Sales ",
        "suffix": "YoY Growth in quarter ended Jun 2026 is 2.93% vs 15.30% in Jun 2025",
        "dir": -1
      },
      {
        "prefix": "Consolidated Net Profit ",
        "suffix": "YoY Growth in quarter ended Jun 2026 is 10.86% vs 20.98% in Jun 2025",
        "dir": -1
      }
    ],
    "table": {
      "header": [
        "Jun'26",
        "Jun'25",
        "Change(%)"
      ],
      "body": [
        {
          "field": "Net Sales",
          "val1": "870.42",
          "val2": "845.67",
          "chgp": "2.93%",
          "chgp_class": "positive"
        },
        {
          "field": "Operating Profit (PBDIT) excl Other Income",
          "val1": "92.66",
          "val2": "85.96",
          "chgp": "7.79%",
          "chgp_class": "positive"
        },
        {
          "field": "Interest",
          "val1": "36.37",
          "val2": "35.14",
          "chgp": "3.50%",
          "chgp_class": "negative"
        },
        {
          "field": "Exceptional Items",
          "val1": "0.00",
          "val2": "0.00",
          "chgp": "",
          "chgp_class": "neutral"
        },
        {
          "field": "Consolidate Net Profit",
          "val1": "35.41",
          "val2": "31.94",
          "chgp": "10.86%",
          "chgp_class": "positive"
        },
        {
          "field": "Operating Profit Margin (Excl OI)",
          "val1": "10.65%",
          "val2": "10.16%",
          "chgp": "0.49%",
          "chgp_class": "positive"
        }
      ]
    }
  },
  {
    "link": "half-yearly",
    "btn_text": "All Half Yearly Results",
    "header": "Half Yearly Results Snapshot (Consolidated) - Sep'25",
    "rhs": [
      {
        "prefix": "Net Sales ",
        "suffix": " Growth in half year ended Sep 2025 is 18.31% vs -5.24% in Sep 2024",
        "dir": 1
      },
      {
        "prefix": "Consolidated Net Profit ",
        "suffix": " Growth in half year ended Sep 2025 is 20.60% vs 20.09% in Sep 2024",
        "dir": 1
      }
    ],
    "table": {
      "header": [
        "Sep'25",
        "Sep'24",
        "Change(%)"
      ],
      "body": [
        {
          "field": "Net Sales",
          "val1": "1,752.23",
          "val2": "1,481.06",
          "chgp": "18.31%",
          "chgp_class": "positive"
        },
        {
          "field": "Operating Profit (PBDIT) excl Other Income",
          "val1": "167.35",
          "val2": "146.83",
          "chgp": "13.98%",
          "chgp_class": "positive"
        },
        {
          "field": "Interest",
          "val1": "69.25",
          "val2": "54.73",
          "chgp": "26.53%",
          "chgp_class": "negative"
        },
        {
          "field": "Exceptional Items",
          "val1": "0.00",
          "val2": "0.00",
          "chgp": "",
          "chgp_class": "neutral"
        },
        {
          "field": "Consolidate Net Profit",
          "val1": "64.22",
          "val2": "53.25",
          "chgp": "20.60%",
          "chgp_class": "positive"
        },
        {
          "field": "Operating Profit Margin (Excl OI)",
          "val1": "9.55%",
          "val2": "9.91%",
          "chgp": "-0.36%",
          "chgp_class": "negative"
        }
      ]
    }
  },
  {
    "link": "nine-monthly",
    "btn_text": "All Nine Monthly Results",
    "header": "Nine Monthly Results Snapshot (Consolidated) - Dec'25",
    "rhs": [
      {
        "prefix": "Net Sales ",
        "suffix": "YoY Growth in nine months ended Dec 2025 is 16.14% vs 0.56% in Dec 2024",
        "dir": 1
      },
      {
        "prefix": "Consolidated Net Profit ",
        "suffix": "YoY Growth in nine months ended Dec 2025 is 16.81% vs 20.03% in Dec 2024",
        "dir": -1
      }
    ],
    "table": {
      "header": [
        "Dec'25",
        "Dec'24",
        "Change(%)"
      ],
      "body": [
        {
          "field": "Net Sales",
          "val1": "2,695.29",
          "val2": "2,320.78",
          "chgp": "16.14%",
          "chgp_class": "positive"
        },
        {
          "field": "Operating Profit (PBDIT) excl Other Income",
          "val1": "249.93",
          "val2": "218.66",
          "chgp": "14.30%",
          "chgp_class": "positive"
        },
        {
          "field": "Interest",
          "val1": "103.22",
          "val2": "85.99",
          "chgp": "20.04%",
          "chgp_class": "negative"
        },
        {
          "field": "Exceptional Items",
          "val1": "0.00",
          "val2": "0.00",
          "chgp": "",
          "chgp_class": "neutral"
        },
        {
          "field": "Consolidate Net Profit",
          "val1": "97.77",
          "val2": "83.70",
          "chgp": "16.81%",
          "chgp_class": "positive"
        },
        {
          "field": "Operating Profit Margin (Excl OI)",
          "val1": "9.27%",
          "val2": "9.42%",
          "chgp": "-0.15%",
          "chgp_class": "negative"
        }
      ]
    }
  },
  {
    "link": "annual",
    "btn_text": "All Annual Results",
    "header": "Annual Results Snapshot (Consolidated) - Mar'26",
    "rhs": [
      {
        "prefix": "Net Sales ",
        "suffix": "YoY Growth in year ended Mar 2026 is 12.20% vs 3.07% in Mar 2025",
        "dir": 1
      },
      {
        "prefix": "Consolidated Net Profit ",
        "suffix": "YoY Growth in year ended Mar 2026 is 16.38% vs 21.28% in Mar 2025",
        "dir": -1
      }
    ],
    "table": {
      "header": [
        "Mar'26",
        "Mar'25",
        "Change(%)"
      ],
      "body": [
        {
          "field": "Net Sales",
          "val1": "3,620.09",
          "val2": "3,226.58",
          "chgp": "12.20%",
          "chgp_class": "positive"
        },
        {
          "field": "Operating Profit (PBDIT) excl Other Income",
          "val1": "355.09",
          "val2": "310.75",
          "chgp": "14.27%",
          "chgp_class": "positive"
        },
        {
          "field": "Interest",
          "val1": "137.52",
          "val2": "119.60",
          "chgp": "14.98%",
          "chgp_class": "negative"
        },
        {
          "field": "Exceptional Items",
          "val1": "0.00",
          "val2": "0.00",
          "chgp": "",
          "chgp_class": "neutral"
        },
        {
          "field": "Consolidate Net Profit",
          "val1": "138.81",
          "val2": "119.27",
          "chgp": "16.38%",
          "chgp_class": "positive"
        },
        {
          "field": "Operating Profit Margin (Excl OI)",
          "val1": "9.81%",
          "val2": "9.63%",
          "chgp": "0.18%",
          "chgp_class": "positive"
        }
      ]
    }
  }
]

Quarterly Results Snapshot (Consolidated) - Jun'26 - YoYstock-summary

Jun'26
Jun'25
Change(%)
Net Sales
870.42
845.67
2.93%
Operating Profit (PBDIT) excl Other Income
92.66
85.96
7.79%
Interest
36.37
35.14
3.50%
Exceptional Items
0.00
0.00
Consolidate Net Profit
35.41
31.94
10.86%
Operating Profit Margin (Excl OI)
10.65%
10.16%
0.49%
Values in Rs Cr.
Direction Arrows
Net Sales

YoY Growth in quarter ended Jun 2026 is 2.93% vs 15.30% in Jun 2025

Direction Arrows
Consolidated Net Profit

YoY Growth in quarter ended Jun 2026 is 10.86% vs 20.98% in Jun 2025

Half Yearly Results Snapshot (Consolidated) - Sep'25stock-summary

Sep'25
Sep'24
Change(%)
Net Sales
1,752.23
1,481.06
18.31%
Operating Profit (PBDIT) excl Other Income
167.35
146.83
13.98%
Interest
69.25
54.73
26.53%
Exceptional Items
0.00
0.00
Consolidate Net Profit
64.22
53.25
20.60%
Operating Profit Margin (Excl OI)
9.55%
9.91%
-0.36%
Values in Rs Cr.
Direction Arrows
Net Sales

Growth in half year ended Sep 2025 is 18.31% vs -5.24% in Sep 2024

Direction Arrows
Consolidated Net Profit

Growth in half year ended Sep 2025 is 20.60% vs 20.09% in Sep 2024

Nine Monthly Results Snapshot (Consolidated) - Dec'25stock-summary

Dec'25
Dec'24
Change(%)
Net Sales
2,695.29
2,320.78
16.14%
Operating Profit (PBDIT) excl Other Income
249.93
218.66
14.30%
Interest
103.22
85.99
20.04%
Exceptional Items
0.00
0.00
Consolidate Net Profit
97.77
83.70
16.81%
Operating Profit Margin (Excl OI)
9.27%
9.42%
-0.15%
Values in Rs Cr.
Direction Arrows
Net Sales

YoY Growth in nine months ended Dec 2025 is 16.14% vs 0.56% in Dec 2024

Direction Arrows
Consolidated Net Profit

YoY Growth in nine months ended Dec 2025 is 16.81% vs 20.03% in Dec 2024

Annual Results Snapshot (Consolidated) - Mar'26stock-summary

Mar'26
Mar'25
Change(%)
Net Sales
3,620.09
3,226.58
12.20%
Operating Profit (PBDIT) excl Other Income
355.09
310.75
14.27%
Interest
137.52
119.60
14.98%
Exceptional Items
0.00
0.00
Consolidate Net Profit
138.81
119.27
16.38%
Operating Profit Margin (Excl OI)
9.81%
9.63%
0.18%
Values in Rs Cr.
Direction Arrows
Net Sales

YoY Growth in year ended Mar 2026 is 12.20% vs 3.07% in Mar 2025

Direction Arrows
Consolidated Net Profit

YoY Growth in year ended Mar 2026 is 16.38% vs 21.28% in Mar 2025

stock-summaryCompany CV
About Pennar Industries Ltd stock-summary
stock-summary
Pennar Industries Ltd
Small Cap
Industrial Manufacturing
Pennar Industries Limited (Formerly known as Pennar Steels Ltd), incorporated in August, 1975, was promoted in the joint sector by J Naresh Kumar along with the Andhra Pradesh Industrial Development Corporation (APIDC). The Company is one of the leading engineering organisation in India and is well known for its expertise in providing engineered products & solutions.
Company Coordinates stock-summary
Company Details
Floor No 3 DHFLVC, Silicon Towers Kondapur Hyderabad Telangana : 500084
stock-summary
Tel: 91-40-23117043/7045/23114072
stock-summary
corporatecommunications@pennarindia
Registrar Details
Karvy Computershare Pvt Ltd., Karvy Selenium, Tower-B Plot No 31 & 32, Survey No 116/22, 115/24, 115/25, Financial District, Nanakramguda, Serilingampally, Mandal Ranga Reddy Dist, Hyderabad