
Compare Perfectpac with Similar Stocks
Stock DNA
Paper, Forest & Jute Products
INR 47 Cr (Micro Cap)
14.00
21
1.39%
0.07
8.20%
1.20
Total Returns (Price + Dividend) 
Latest dividend: 1 per share ex-dividend date: Sep-04-2025
Risk Adjusted Returns v/s
Returns Beta

News

Perfectpac Ltd is Rated Strong Sell
Perfectpac Ltd is rated Strong Sell by MarketsMOJO. This rating was last updated on 07 Feb 2025. However, the analysis and financial metrics discussed below reflect the company’s current position as of 15 July 2026, providing investors with an up-to-date view of the stock’s fundamentals, returns, and technical outlook.
Read full news article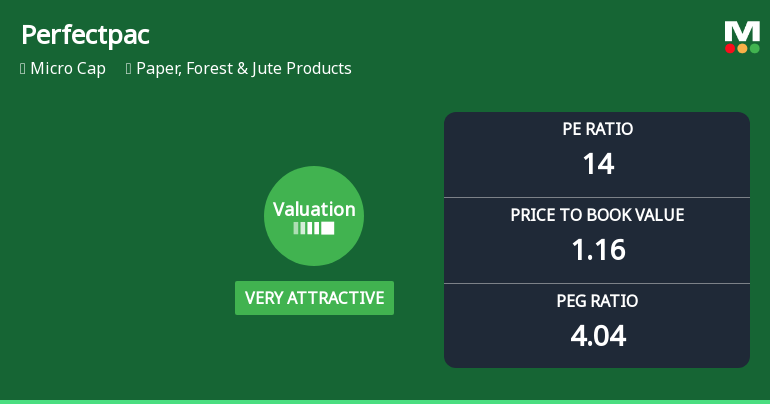
Perfectpac Ltd Valuation Shifts Signal Renewed Price Attractiveness Amid Mixed Returns
Perfectpac Ltd, a micro-cap player in the Paper, Forest & Jute Products sector, has witnessed a notable shift in its valuation parameters, moving from an attractive to a very attractive rating. Despite a challenging market environment and underperformance relative to the Sensex, the company’s current price-to-earnings (P/E) and price-to-book value (P/BV) ratios suggest a compelling entry point for discerning investors.
Read full news article
Perfectpac Ltd is Rated Strong Sell
Perfectpac Ltd is rated Strong Sell by MarketsMOJO, with this rating last updated on 07 Feb 2025. However, the analysis and financial metrics discussed here reflect the stock’s current position as of 30 June 2026, providing investors with an up-to-date view of its fundamentals, returns, and technical outlook.
Read full news article Announcements
Compliances-Certificate under Reg. 74 (5) of SEBI (DP) Regulations 2018
03-Jul-2026 | Source : BSEPlease refer the enclosed certificate under Regulation 74(5) of the SEBI (Depositories and Participants) Regulations 2018 for the quarter ended June 30 2026.
Closure of Trading Window
24-Jun-2026 | Source : BSEIntimation of closure of Trading Window for the purpose of announcement of Unaudited Financial Results for the quarter ending on June 30 2026.
Announcement under Regulation 30 (LODR)-Newspaper Publication
11-Jun-2026 | Source : BSESubmission of copies of newspaper Advertisement informing the shareholders about the another special window that has been opened for re-lodgement of transfer deeds of physical securities.
Corporate Actions

No Upcoming Board Meetings

Perfectpac Ltd has declared 50% dividend, ex-date: 04 Sep 25

Perfectpac Ltd has announced 2:10 stock split, ex-date: 21 Oct 22

No Bonus history available

Perfectpac Ltd has announced 1:1 rights issue, ex-date: 11 Sep 09
Quality key factors
Valuation key factors
Technicals key factors
 Technical Indicator Scale: Bearish, Mildly Bearish, Sideways, Mildly Bullish, Bullish Turned
 Shareholding Snapshot : Jun 2026
Shareholding Compare (%holding)
Promoters
None
Held by 0 Schemes
Held by 0 FIIs
Sanjay Rajgarhia (51.63%)
Bhavana Govindbhai Desai (2%)
23.9%
Quarterly Results Snapshot (Standalone) - Mar'26 - QoQ

QoQ Growth in quarter ended Mar 2026 is 18.36% vs -14.68% in Dec 2025
QoQ Growth in quarter ended Mar 2026 is 2,025.00% vs -103.33% in Dec 2025
Half Yearly Results Snapshot (Standalone) - Sep'25

Growth in half year ended Sep 2025 is 5.54% vs 13.45% in Sep 2024
Growth in half year ended Sep 2025 is 34.64% vs -23.50% in Sep 2024
Nine Monthly Results Snapshot (Standalone) - Dec'25
YoY Growth in nine months ended Dec 2025 is 2.74% vs 11.86% in Dec 2024
YoY Growth in nine months ended Dec 2025 is -4.05% vs -12.72% in Dec 2024
Annual Results Snapshot (Standalone) - Mar'26
YoY Growth in year ended Mar 2026 is 0.24% vs 12.20% in Mar 2025
YoY Growth in year ended Mar 2026 is 0.00% vs -20.85% in Mar 2025
About Perfectpac Ltd

Company Coordinates


