
Compare Permanent Magnet with Similar Stocks
Dashboard
Poor long term growth as Net Sales has grown by an annual rate of 14.08% and Operating profit at 3.72% over the last 5 years
Flat results in Mar 26
With ROCE of 11.6, it has a Very Expensive valuation with a 4 Enterprise value to Capital Employed
Despite the size of the company, domestic mutual funds hold only 0% of the company
Consistent Underperformance against the benchmark over the last 3 years
Stock DNA
Other Electrical Equipment
INR 716 Cr (Micro Cap)
47.00
34
0.25%
0.21
9.85%
4.43
Total Returns (Price + Dividend) 
Latest dividend: 2 per share ex-dividend date: Jul-30-2025
Risk Adjusted Returns v/s
Returns Beta

News

Permanent Magnets Ltd is Rated Sell
Permanent Magnets Ltd is rated 'Sell' by MarketsMOJO, with this rating last updated on 20 May 2026. However, the analysis and financial metrics discussed here reflect the stock's current position as of 12 June 2026, providing investors with the latest insights into the company’s performance and outlook.
Read full news article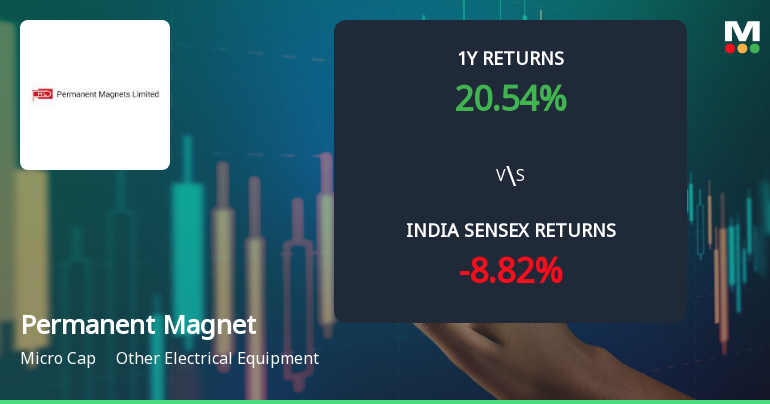
Permanent Magnets Ltd Technical Momentum Shifts Amid Mixed Indicator Signals
Permanent Magnets Ltd, a micro-cap player in the Other Electrical Equipment sector, has experienced a subtle shift in its technical momentum, prompting a downgrade in its Mojo Grade from Hold to Sell as of 20 May 2026. Despite a modest 0.38% decline in its latest trading session, the stock’s technical indicators reveal a complex interplay of bullish and bearish signals across different timeframes, reflecting cautious investor sentiment amid broader market volatility.
Read full news article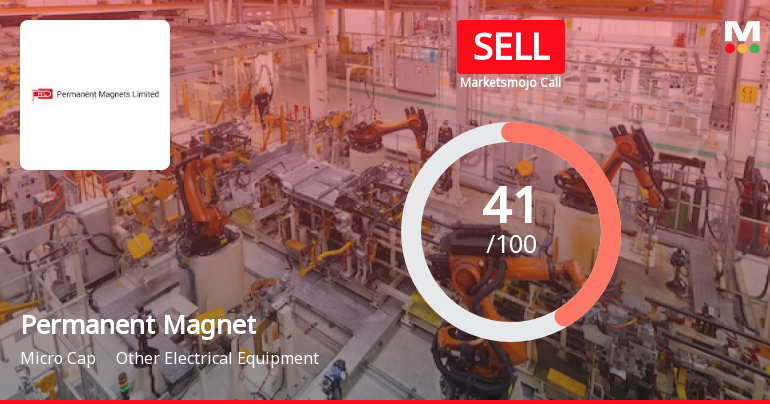
Permanent Magnets Ltd is Rated Sell
Permanent Magnets Ltd is rated 'Sell' by MarketsMOJO, with this rating last updated on 20 May 2026. However, the analysis and financial metrics discussed here reflect the stock’s current position as of 01 June 2026, providing investors with the latest insights into the company’s performance and outlook.
Read full news article Announcements
Announcement under Regulation 30 (LODR)-Analyst / Investor Meet - Outcome
21-May-2026 | Source : BSETranscript of Conference Call with reference to the Audited Financial Results for the quarter and year ended March 31 2026
Announcement under Regulation 30 (LODR)-Analyst / Investor Meet - Intimation
19-May-2026 | Source : BSEIntimation of Schedule of Analyst/ Investor Meeting under Regulation 30 of SEBI (Listing Obligations and Disclosure Requirements) Regulations 2015
Compliances-Reg.24(A)-Annual Secretarial Compliance
18-May-2026 | Source : BSESecretarial Compliance Report for the Year ended March 2026
Corporate Actions

No Upcoming Board Meetings

Permanent Magnets Ltd has declared 20% dividend, ex-date: 30 Jul 25

No Splits history available

No Bonus history available

No Rights history available
Quality key factors
Valuation key factors
Technicals key factors
 Technical Indicator Scale: Bearish, Mildly Bearish, Sideways, Mildly Bullish, Bullish Turned
 Shareholding Snapshot : Mar 2026
Shareholding Compare (%holding)
Promoters
None
Held by 0 Schemes
Held by 0 FIIs
Mukul Taparia (16.3%)
Ramesh Taparia (2.46%)
35.22%
Quarterly Results Snapshot (Consolidated) - Mar'26 - YoY

YoY Growth in quarter ended Mar 2026 is 46.95% vs -15.52% in Mar 2025
YoY Growth in quarter ended Mar 2026 is 152.53% vs -37.05% in Mar 2025
Half Yearly Results Snapshot (Consolidated) - Sep'25

Growth in half year ended Sep 2025 is -7.01% vs 13.43% in Sep 2024
Growth in half year ended Sep 2025 is -29.68% vs -12.48% in Sep 2024
Nine Monthly Results Snapshot (Consolidated) - Dec'25
YoY Growth in nine months ended Dec 2025 is -0.04% vs 8.04% in Dec 2024
YoY Growth in nine months ended Dec 2025 is -23.92% vs -19.94% in Dec 2024
Annual Results Snapshot (Consolidated) - Mar'26
YoY Growth in year ended Mar 2026 is 10.33% vs 1.77% in Mar 2025
YoY Growth in year ended Mar 2026 is -6.22% vs -22.03% in Mar 2025
About Permanent Magnets Ltd

Company Coordinates


