
Compare Persistent Syste with Similar Stocks
Dashboard
Strong Long Term Fundamental Strength with an average Return on Equity (ROE) of 22.63%
- Healthy long term growth as Net Sales has grown by an annual rate of 28.63% and Operating profit at 36.36%
- The company is Net-Debt Free
With a growth in Net Profit of 20.44%, the company declared Very Positive results in Mar 26
With ROE of 24.7, it has a Very Expensive valuation with a 10.9 Price to Book Value
High Institutional Holdings at 51.03%
Consistent Returns over the last 3 years
Stock DNA
Computers - Software & Consulting
INR 87,730 Cr (Mid Cap)
44.00
21
0.74%
-0.21
24.68%
10.92
Total Returns (Price + Dividend) 
Latest dividend: 17.97184300341297 per share ex-dividend date: Jul-27-2026
Risk Adjusted Returns v/s
Returns Beta

News

Persistent Systems Ltd Sees Robust Trading Activity Amid Sector Gains
Persistent Systems Ltd, a mid-cap player in the Computers - Software & Consulting sector, has emerged as one of the most actively traded stocks by value on 28 July 2026. The stock demonstrated strong momentum with a 4.28% gain on the day, supported by rising investor participation and outperformance relative to its sector and benchmark indices.
Read full news article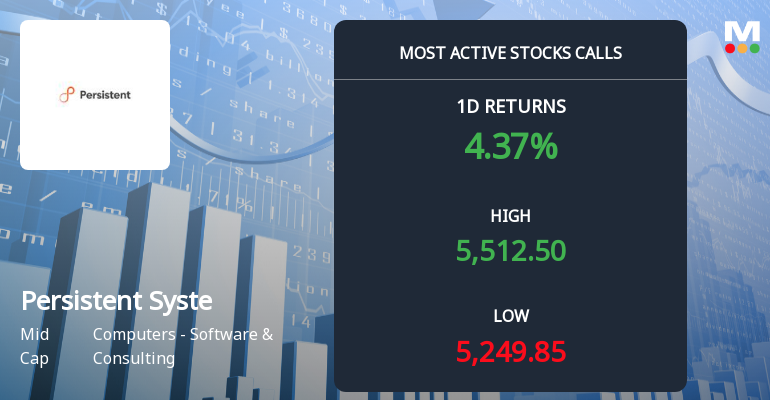
5,436 Call Contracts Traded on Persistent Systems Ltd as Stock Gains 4.28% on 28 Jul 2026
5,436 call contracts at the Rs 5,500 strike changed hands on Persistent Systems Ltd on 28 Jul 2026, with the stock closing at Rs 5,476 after a 4.28% gain. This synchrony between options activity and cash market performance highlights a clear directional interest in the near-term expiry.
Read full news article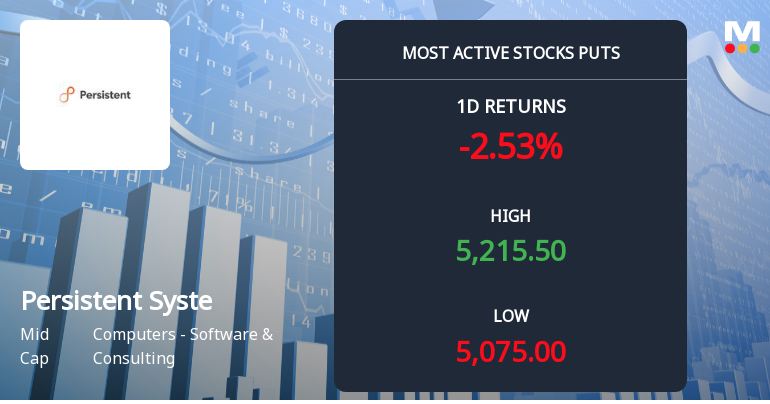
Rs 5,100 Puts Draw 5,857 Contracts on Persistent Systems Ltd as Stock Tests Key Support
The Rs 5,100 put strike on Persistent Systems Ltd attracted 5,857 contracts on 21 Jul 2026, just below the stock’s closing price of Rs 5,110.4. This surge in put activity coincides with a 2.34% decline in the stock, raising questions about whether traders are positioning for further downside or hedging existing gains.
Read full news article Announcements
Board Meeting Intimation for Intimation Under Regulation 29 Of The SEBI (Listing Obligations And Disclosure Requirements) Regulations 2015
17-Jul-2026 | Source : BSEPersistent Systems Ltdhas informed BSE that the meeting of the Board of Directors of the Company is scheduled on 02/08/2026 inter alia to consider and approve We wish to inform you that the meeting of the Board of Directors of Persistent Systems Limited (the Company) is scheduled to be held on Saturday August 1 2026 and will continue on Sunday August 2 2026 at the Registered Office of the Company to consider inter alia the following businesses: 1. The Audited Financial Results of the Company for the quarter ended June 30 2026; 2. The Audited Financial Results of the Company and its subsidiaries for the quarter ended June 30 2026; Please note that the Board of Directors will consider the aforesaid business items on Sunday August 2 2026 (IST).
Compliances-Certificate under Reg. 74 (5) of SEBI (DP) Regulations 2018
14-Jul-2026 | Source : BSEThe Certificate under Reg. 74(5) of SEBI (DP) Regulations 2018 is as enclosed.
Business Responsibility and Sustainability Reporting (BRSR)
11-Jul-2026 | Source : BSEThe Business Responsibility and Sustainability Report is as enclosed.
Corporate Actions

02 Aug 2026

Persistent Systems Ltd has declared 360% dividend, ex-date: 27 Jul 26

Persistent Systems Ltd has announced 5:10 stock split, ex-date: 28 Mar 24

Persistent Systems Ltd has announced 1:1 bonus issue, ex-date: 10 Mar 15

No Rights history available
Quality key factors
Valuation key factors
Technicals key factors
 Technical Indicator Scale: Bearish, Mildly Bearish, Sideways, Mildly Bullish, Bullish Turned
 Shareholding Snapshot : Jun 2026
Shareholding Compare (%holding)
Promoters
None
Held by 41 Schemes (21.32%)
Held by 771 FIIs (20.79%)
Anand Suresh Deshpande (29.02%)
Hdfc Mutual Fund - Hdfc Mid-cap Fund (4.41%)
13.96%
Quarterly Results Snapshot (Consolidated) - Mar'26 - QoQ

QoQ Growth in quarter ended Mar 2026 is 7.35% vs 5.52% in Dec 2025
QoQ Growth in quarter ended Mar 2026 is 20.44% vs -6.79% in Dec 2025
Half Yearly Results Snapshot (Consolidated) - Sep'25
Growth in half year ended Sep 2025 is 22.72% vs 19.05% in Sep 2024
Growth in half year ended Sep 2025 is 41.97% vs 28.32% in Sep 2024
Nine Monthly Results Snapshot (Consolidated) - Dec'25
YoY Growth in nine months ended Dec 2025 is 22.95% vs 20.27% in Dec 2024
YoY Growth in nine months ended Dec 2025 is 33.00% vs 29.07% in Dec 2024
Annual Results Snapshot (Consolidated) - Mar'26
YoY Growth in year ended Mar 2026 is 23.53% vs 21.56% in Mar 2025
YoY Growth in year ended Mar 2026 is 33.21% vs 28.05% in Mar 2025
About Persistent Systems Ltd

Company Coordinates


