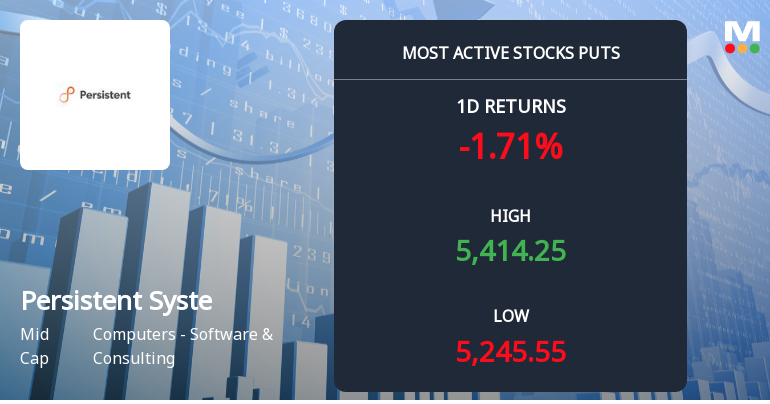
Persistent Syste

  • Market Cap: Mid Cap
  • Industry: Computers - Software & Consulting
  • ISIN: INE262H01021
  • NSEID: PERSISTENT
  • BSEID: 533179
INR
5,475.00
-43.65 (-0.79%)
BSENSE

Aug 07, 03:30 PM

BSE+NSE Vol: 5.4 lacs

  • Price Points
  • Score
  • Mojo Parameters
  • Total Return
  • News and Corporate Actions
  • Key factors
  • Shareholding
  • Financials
  • CompanyCV
stock-summaryPrice Point
High/Low

1Day

52 Week

Valuation
Technical
Day's Volume

CASH

5.4 lacs (-14.61%) Volume

Shareholding (Jun 2026)

FII

20.79%

Held by 771 FIIs

DII

30.25%

Held by 53 DIIs

Promoter

30.29%

Why is Persistent Systems Ltd falling/rising?

08-Aug-2026

As of 08-Aug, the stock price of Persistent Systems Ltd is declining, currently at 5,475.00, with a decrease of 0.79%. Despite strong long-term fundamentals, recent market sentiment has led to consecutive losses and reduced investor participation.

As of 08-Aug, the stock price of Persistent Systems Ltd is falling, currently at 5,475.00, reflecting a decrease of 43.65 (-0.79%). This decline is evident as the stock has underperformed its sector by 2.41% today and has experienced consecutive losses over the last two days, totaling a drop of 1.17%. Additionally, the stock's performance over the past week shows a decline of 1.35%, while the benchmark Sensex has risen by 0.52% during the same period.<BR><BR>Investor participation has also decreased, with delivery volume on August 6 falling by 67.11% compared to the 5-day average, indicating reduced trading interest. Although the stock is trading above its 20-day, 50-day, and 100-day moving averages, it is below its 5-day and 200-day moving averages, suggesting a bearish trend in the short term.<BR><BR>Despite these negative indicators, Persistent Systems Ltd has strong long-term fundamentals, including a healthy growth rate in net sales and operating profit, as well as a net-debt-free status. However, the current market sentiment appears to be affecting the stock negatively, contributing to its recent price decline.

View full answer

Should I buy, sell or hold Persistent Systems Ltd?

04-Aug-2026

Are Persistent Systems Ltd latest results good or bad?

03-Aug-2026

Persistent Systems Ltd's latest results show strong revenue growth of 29.09% year-on-year, but profitability has declined, with net profit down 8.73% from the previous quarter and margins compressing, leading to cautious investor sentiment and a slight drop in stock price.

The latest results for Persistent Systems Ltd present a mixed picture. On one hand, the company achieved impressive revenue growth, with net sales reaching ₹4,303.23 crores, marking a 29.09% increase year-on-year and a 6.10% rise quarter-on-quarter. This growth reflects strong client acquisition and expansion in key sectors, which is a positive sign for the company's operational momentum.<BR><BR>However, the profitability metrics have raised concerns. The net profit for the quarter was ₹483.04 crores, which represents an 8.73% decline from the previous quarter, marking the first quarterly profit contraction since December 2025. Additionally, both operating margins and profit after tax (PAT) margins have compressed significantly, with operating margins falling to 16.19% from 18.93% in the previous quarter. This deterioration in margins suggests that while revenue is growing, the costs associated with that growth, particularly employee expenses, are impacting profitability.<BR><BR>Investor sentiment appears cautious, as indicated by a 1.08% decline in the stock price following the results announcement. The company's premium valuation, trading at 43 times trailing earnings compared to the industry average of 21, adds to the scrutiny regarding its ability to sustain margins while pursuing aggressive growth.<BR><BR>In summary, while Persistent Systems continues to show strong revenue growth, the decline in profitability and margin pressures are significant concerns that could affect its valuation and investor confidence moving forward.

View full answer

How big is Persistent Syste?

11-Jun-2026

As of 10th June, Persistent Systems Ltd has a market capitalization of 79,389.00 Cr, with recent Net Sales of 14,748.46 Cr and a Net Profit of 1,865.12 Cr. Shareholder's Funds are 6,319.06 Cr and Total Assets are 8,534.18 Cr.

As of 10th June, Persistent Systems Ltd has a market capitalization of 79,389.00 Cr, categorizing it as a Mid Cap company.<BR><BR>In the latest four quarters, the company reported Net Sales of 14,748.46 Cr and a Net Profit of 1,865.12 Cr.<BR><BR>For the latest annual period ending in March 2025, the Shareholder's Funds amounted to 6,319.06 Cr, while the Total Assets were valued at 8,534.18 Cr.

View full answer

Who are in the management team of Persistent Syste?

11-Jun-2026

The management team of Persistent Systems includes Anand Deshpande (Chairman & Managing Director), Sandeep Kalra (CEO), and Sunil Yeshwant Sapre (CFO), along with several independent directors such as Roshini Bakshi and Praveen Kadle, bringing diverse expertise to the company.

The management team of Persistent Systems includes the following key members:<BR><BR>1. **Anand Deshpande** - Chairman & Managing Director<BR>2. **Amit Atre** - Company Secretary & Compliance Officer<BR>3. **Sandeep Kalra** - Executive Director & CEO<BR>4. **Sunil Yeshwant Sapre** - Executive Director & CFO<BR><BR>Additionally, the board features several independent directors:<BR><BR>1. **Roshini Bakshi**<BR>2. **Praveen Kadle**<BR>3. **Avani Davda**<BR>4. **Danl Lewin**<BR>5. **Arvind Goel**<BR>6. **Ambuj Goyal**<BR>7. **Ajit Keshav Ranade**<BR><BR>This diverse team brings a wealth of experience and expertise to the company.

View full answer

Who are the peers of the Persistent Syste?

11-Jun-2026

Peers of Persistent Systems include Infosys, HCL Technologies, Wipro, Tech Mahindra, LTM, Coforge, Mphasis, L&T Technology, and Hexaware Tech. Persistent Systems has a 1-year return of -17.68%, better than HCL Technologies' -36.01% but worse than Tata Technologies' -5.31%.

Peers: The peers of Persistent Syste are Infosys, HCL Technologies, Wipro, Tech Mahindra, LTM, Coforge, Mphasis, L&T Technology, and Hexaware Tech.<BR><BR>Quality Snapshot: Excellent management risk is observed at Infosys, HCL Technologies, LTM, Persistent Syste, Coforge, and L&T Technology, while Good management risk is found at Wipro, Tech Mahindra, Mphasis, and Hexaware Tech. Average growth is noted for Infosys and HCL Technologies, while Excellent growth is seen at LTM, Persistent Syste, Coforge, and Hexaware Tech. Wipro and Tech Mahindra exhibit Below Average growth, and the rest have varying ratings. All peers maintain an Excellent capital structure except for Wipro and Tech Mahindra, which have an Excellent rating as well.<BR><BR>Return Snapshot: The peer with the highest 1-year return is Tata Technolog. at -5.31%, while the peer with the lowest is HCL Technologies at -36.01%. Persistent Syste's 1-year return of -17.68% is better than HCL Technologies but worse than Tata Technolog. Additionally, several peers, including Infosys, HCL Technologies, Wipro, LTM, Coforge, and Hexaware Tech, have negative six-month returns.

View full answer

What does Persistent Syste do?

10-Jun-2026

Persistent Systems Ltd is a mid-cap company in the software and consulting industry, focusing on telecommunications, life sciences, and infrastructure. As of March 2026, it reported net sales of ₹4,056 Cr and a net profit of ₹529 Cr, with a market cap of ₹79,389 Cr.

Overview:<BR>Persistent Systems Ltd is a mid-cap company operating in the Computers - Software & Consulting industry, specializing in telecommunications, life sciences, and infrastructure and systems.<BR><BR>History:<BR>Persistent Systems Limited was incorporated as 'Persistent Systems Private Limited' in 1990 and transitioned to a public limited company in September 2007. The latest quarterly results reported net sales and net profit for the period ending March 2026.<BR><BR>Financial Snapshot:<BR>- Net Sales: 4,056 Cr (Quarterly Results - Mar 2026)<BR>- Net Profit: 529 Cr (Quarterly Results - Mar 2026)<BR>- Market Cap: INR 79,389 Cr (Mid Cap)<BR><BR>Key Metrics:<BR>- P/E: 40.00<BR>- Industry P/E: 20<BR>- Dividend Yield: 0.73%<BR>- Debt Equity: -0.21<BR>- Return on Equity: 24.68%<BR>- Price to Book: 10.10<BR><BR>Contact Details:<BR>- Address: Bhageerath, 402 Senapati Bapat Road Pune Maharashtra : 411016<BR>- Phone: 91-020-67030000/67462084<BR>- Email: info@persistent.com<BR>- Website: http://www.persistentsys.com

View full answer

Has Persistent Systems Ltd declared dividend?

22-Jan-2026

Yes, Persistent Systems Ltd has declared a dividend of 440%, amounting to ₹15 per share, with an ex-date of January 27, 2026. The company has shown strong total returns over various periods, particularly in the long term.

Persistent Systems Ltd has declared a dividend.<BR><BR>Dividend Details:<BR>- Percentage announced: 440%<BR>- Amount per share: 15<BR>- Ex-date: 27 Jan 26<BR><BR>Dividend Yield: 0.55%<BR><BR>Total Returns by Period:<BR>In the 3 Months period, the price return was 8.95%, the dividend return was 0.38%, resulting in a total return of 9.33%.<BR><BR>In the 6 Months period, the price return was 10.11%, the dividend return was 0.43%, resulting in a total return of 10.54%.<BR><BR>In the 1 Year period, the price return was 11.15%, the dividend return was 0.94%, resulting in a total return of 12.09%.<BR><BR>In the 2 Years period, the price return was 59.49%, the dividend return was 1.58%, resulting in a total return of 61.07%.<BR><BR>In the 3 Years period, the price return was 192.29%, the dividend return was 4.52%, resulting in a total return of 196.81%.<BR><BR>In the 4 Years period, the price return was 193.73%, the dividend return was 7.50%, resulting in a total return of 201.23%.<BR><BR>In the 5 Years period, the price return was 718.37%, the dividend return was 20.28%, resulting in a total return of 738.65%.<BR><BR>Overall, Persistent Systems Ltd has declared a significant dividend, and the total returns over various periods indicate strong performance, particularly over the longer term, suggesting a positive outlook for investors.

View full answer

Is Persistent Syste technically bullish or bearish?

05-Dec-2025

As of December 4, 2025, the technical trend is bullish, supported by strong weekly indicators, despite some mild bearish signals in the monthly MACD and KST.

As of 4 December 2025, the technical trend has changed from mildly bullish to bullish. The current stance is bullish with strong indicators supporting this view. The weekly MACD is bullish, and both the weekly and monthly Bollinger Bands are bullish. Daily moving averages also confirm a bullish trend. Although the monthly MACD and KST are mildly bearish, the overall strength of the weekly indicators suggests a strong bullish sentiment. The stock has shown positive returns over the past month and year, outperforming the Sensex in those periods.

View full answer

How has been the historical performance of Persistent Syste?

01-Dec-2025

Persistent Syste has demonstrated consistent growth, with net sales increasing from 3,365.94 crore in March 2019 to 11,938.72 crore in March 2025, and net profit rising from 351.68 crore to 1,400.16 crore during the same period, reflecting strong financial health and effective cash management.

Answer:<BR>The historical performance of Persistent Syste shows a consistent growth trend in net sales and profits over the years, culminating in a net profit of 1,400.16 crore for the year ending March 2025.<BR><BR>Breakdown:<BR>Persistent Syste's net sales have increased significantly from 3,365.94 crore in March 2019 to 11,938.72 crore in March 2025, reflecting a robust growth trajectory. The total operating income followed a similar upward trend, reaching 11,938.72 crore in March 2025, up from 3,365.94 crore in March 2019. The company's operating profit (PBDIT) also saw substantial growth, rising to 2,196.35 crore in March 2025 from 643.90 crore in March 2019. Profit before tax increased to 1,822.31 crore in March 2025, compared to 486.34 crore in March 2019, while profit after tax reached 1,400.16 crore, up from 351.68 crore in March 2019. The company's total assets grew from 2,996.16 crore in March 2019 to 8,534.18 crore in March 2025, indicating a strong asset base. Total liabilities also increased, but the company managed to eliminate long-term borrowings by March 2025, showcasing improved financial health. Cash flow from operating activities rose to 1,156 crore in March 2025, demonstrating effective cash management. Overall, Persistent Syste has shown remarkable growth in revenue, profitability, and asset management over the years.

View full answer

Is Persistent Sys overvalued or undervalued?

09-Jun-2025

As of June 5, 2024, Persistent Systems is considered very expensive with a PE ratio of 63.45, significantly higher than competitors like TCS and Infosys, indicating it may be overvalued despite a strong one-year return of 49.87%.

As of 5 June 2024, the valuation grade for Persistent Systems has moved from expensive to very expensive. This indicates a significant shift in the perception of the company's valuation, suggesting it is now overvalued. The company currently has a PE ratio of 63.45, a Price to Book Value of 14.06, and an EV to EBITDA of 42.65, all of which are considerably higher than its peers. <BR><BR>In comparison, TCS and Infosys, which are key competitors, have PE ratios of 25.23 and 24.32, respectively, highlighting the premium at which Persistent Systems is trading. Given these metrics and the overall market context, Persistent Systems appears overvalued. Despite a strong one-year return of 49.87% compared to the Sensex's 7.60%, the elevated valuation ratios suggest that investors may be pricing in excessive growth expectations.

View full answer

Who are the top shareholders of the Persistent Sys?

06-Jun-2025

The top shareholders of Persistent Systems include Anand Suresh Deshpande with 29.35%, mutual funds at 21.74%, foreign institutional investors at 24.36%, and individual investors holding 13.76%, with the Motilal Oswal Midcap Fund being the largest public shareholder at 4.63%.

The top shareholders of Persistent Systems include the promoters, who hold a significant majority of the shares. The promoter with the highest holding is Anand Suresh Deshpande, with a stake of 29.35%. Additionally, mutual funds collectively hold 21.74% of the shares through 36 schemes, while foreign institutional investors (FIIs) account for 24.36% with 807 FIIs involved. The highest public shareholder is the Motilal Oswal Midcap Fund, which holds 4.63%. Individual investors also have a notable presence, holding 13.76% of the shares.

View full answer

When is the next results date for Persistent Sys?

06-Jun-2025

No Upcoming Board Meetings

What is the bonus history of the Persistent Sys?

06-Jun-2025

Persistent Systems issued a 1:1 bonus on March 10, 2015, with a record date of March 11, 2015, allowing shareholders to receive one additional share for each share held.

Persistent Systems has a bonus history that includes a notable 1:1 bonus issue announced on March 10, 2015. The record date for this bonus was March 11, 2015. This means that shareholders received one additional share for every share they held as of the record date.

View full answer
iScoreScore
Click here to find our call on this stock
Strong Sell
Sell
Hold
Buy
Strong Buy

Dashboard

1

Strong Long Term Fundamental Strength with an average Return on Equity (ROE) of 22.63%

  • Healthy long term growth as Net Sales has grown by an annual rate of 28.85% and Operating profit at 33.85%
  • The company is Net-Debt Free
2

The company has declared Positive results for the last 10 consecutive quarters

3

With ROE of 24.7, it has a Very Expensive valuation with a 11 Price to Book Value

4

High Institutional Holdings at 51.03%

5

Consistent Returns over the last 3 years

stock-summaryMojo Parameters

Mojo Parameters

Loading Valuation Snapshot...

Stock DNA

stock-summary
Industry

Computers - Software & Consulting

stock-summary
Market cap

INR 87,867 Cr (Mid Cap)

stock-summary
P/E

43.00

stock-summary
Industry P/E

21

stock-summary
Dividend Yield

0.72%

stock-summary
Debt Equity

-0.21

stock-summary
Return on Equity

24.68%

stock-summary
Price to Book

11.11

Revenue and Profits:
Net Sales:
4,303 Cr
(Quarterly Results - Jun 2026)
Net Profit:
483 Cr
stock-summaryTotal Returns
Total Returns (Price + Dividend) stock-summary
Dividend Yield (0.72%)
TimePeriod
Price Return
Dividend Return
Total Return
3 Months
9.87%
0.35%
10.22%
6 Months
-6.34%
0.31%
-6.03%
1 Year
5.65%
0.76%
6.41%
2 Years
17.1%
1.53%
18.63%
3 Years
124.33%
3.93%
128.26%
4 Years
188.73%
6.83%
195.56%
5 Years
251.13%
7.68%
258.81%

Latest dividend: 17.97184300341297 per share ex-dividend date: Jul-27-2026

Risk Adjusted Returns v/s stock-summary
Returns Beta
Icon
Beta has not been calculated since enough price history is not available
stock-summaryNews & Corporate Actions

News

Persistent Systems Ltd Declines 1.35% Amid Mixed Technical Signals and Option Activity

Key Events This Week

3 Aug: Positive quarterly results announced with strong revenue growth

3 Aug: Heavy put option activity signals bearish sentiment

3 Aug: Upgrade to Buy rating by MarketsMOJO on strong fundamentals

3 Aug: Technical momentum shifts to mildly bullish

4 Aug: Technical momentum shifts amid mixed market signals

7 Aug: Week closes with stock down 1.35% despite Sensex gains

Announcements stock-summary

Announcement under Regulation 30 (LODR)-Press Release / Media Release

06-Aug-2026 | Source : BSE

The Press Release titled Acceptance Period Commences: Persistent Publishes Public Takeover Offer for all Nagarro Shares is as enclosed.

Announcement Of The Voting Results Of The 36Th Annual General Meeting Of The Company

05-Aug-2026 | Source : BSE

The Voting results of the 36th AGM are as enclosed.

Announcement under Regulation 30 (LODR)-Analyst / Investor Meet - Outcome

05-Aug-2026 | Source : BSE

The Outcome of the Non-Deal Roadshow held on Wednesday August 5 2026 is as enclosed.

Corporate Actions stock-summary

stock-summary
BOARD MEETING

No Upcoming Board Meetings

stock-summary
DIVIDEND

Persistent Systems Ltd has declared 360% dividend, ex-date: 27 Jul 26

stock-summary
SPLITS

Persistent Systems Ltd has announced 5:10 stock split, ex-date: 28 Mar 24

stock-summary
BONUS

Persistent Systems Ltd has announced 1:1 bonus issue, ex-date: 10 Mar 15

stock-summary
RIGHTS

No Rights history available

stock-summaryKey Factors

Quality key factors stock-summary

Factor
Value
Sales Growth (5y)
28.85%
EBIT Growth (5y)
33.85%
EBIT to Interest (avg)
32.35
Debt to EBITDA (avg)
0.32
Net Debt to Equity (avg)
-0.21
Sales to Capital Employed (avg)
1.71
Tax Ratio
22.42%
Dividend Payout Ratio
38.96%
Pledged Shares
0
Institutional Holding
51.03%
ROCE (avg)
33.98%
ROE (avg)
22.63%

Valuation key factors

Factor
Value
P/E Ratio
43
Industry P/E
21
Price to Book Value
11.02
EV to EBIT
34.49
EV to EBITDA
29.41
EV to Capital Employed
13.70
EV to Sales
5.39
PEG Ratio
1.44
Dividend Yield
0.73%
ROCE (Latest)
38.70%
ROE (Latest)
24.68%

Technicals key factors

Indicator
Weekly
Monthly
MACD
Mildly Bullish
Mildly Bearish
RSI
No Signal
No Signal
Bollinger Bands
Mildly Bullish
Mildly Bullish
Moving Averages
Mildly Bearish (Daily)
KST
Mildly Bullish
Mildly Bearish
Dow Theory
No Trend
No Trend
OBV
Mildly Bullish
Mildly Bullish
stock-summary Technical Indicator Scale: Bearish, Mildly Bearish, Sideways, Mildly Bullish, Bullish  Turned 
stock-summaryShareholding
Shareholding Snapshot : Jun 2026stock-summary
Shareholding Compare (%holding) stock-summary
Majority shareholders

Promoters

Pledged Promoter Holdings

None

Mutual Funds

Held by 41 Schemes (21.32%)

FIIs

Held by 771 FIIs (20.79%)

Promoter with highest holding

Anand Suresh Deshpande (29.02%)

Highest Public shareholder

Hdfc Mutual Fund - Hdfc Mid-cap Fund (4.41%)

Individual Investors Holdings

13.96%

stock-summaryFinancial
[
  {
    "link": "quarterly",
    "btn_text": "All Quarterly Results",
    "header": "Quarterly Results Snapshot (Consolidated) - Jun'26 - QoQ",
    "rhs": [
      {
        "prefix": "Net Sales ",
        "suffix": "QoQ Growth in quarter ended Jun 2026 is 6.10% vs 7.35% in Mar 2026",
        "dir": -1
      },
      {
        "prefix": "Consolidated Net Profit ",
        "suffix": "QoQ Growth in quarter ended Jun 2026 is -8.73% vs 20.44% in Mar 2026",
        "dir": -1
      }
    ],
    "table": {
      "header": [
        "Jun'26",
        "Mar'26",
        "Change(%)"
      ],
      "body": [
        {
          "field": "Net Sales",
          "val1": "4,303.23",
          "val2": "4,055.94",
          "chgp": "6.10%",
          "chgp_class": "positive"
        },
        {
          "field": "Operating Profit (PBDIT) excl Other Income",
          "val1": "696.90",
          "val2": "767.71",
          "chgp": "-9.22%",
          "chgp_class": "negative"
        },
        {
          "field": "Interest",
          "val1": "29.14",
          "val2": "18.68",
          "chgp": "56.00%",
          "chgp_class": "negative"
        },
        {
          "field": "Exceptional Items",
          "val1": "0.00",
          "val2": "0.00",
          "chgp": "",
          "chgp_class": "neutral"
        },
        {
          "field": "Consolidate Net Profit",
          "val1": "483.04",
          "val2": "529.26",
          "chgp": "-8.73%",
          "chgp_class": "negative"
        },
        {
          "field": "Operating Profit Margin (Excl OI)",
          "val1": "16.19%",
          "val2": "18.93%",
          "chgp": "-2.74%",
          "chgp_class": "negative"
        }
      ]
    }
  },
  {
    "link": "half-yearly",
    "btn_text": "All Half Yearly Results",
    "header": "Half Yearly Results Snapshot (Consolidated) - Sep'25",
    "rhs": [
      {
        "prefix": "Net Sales ",
        "suffix": " Growth in half year ended Sep 2025 is 22.72% vs 19.05% in Sep 2024",
        "dir": 1
      },
      {
        "prefix": "Consolidated Net Profit ",
        "suffix": " Growth in half year ended Sep 2025 is 41.97% vs 28.32% in Sep 2024",
        "dir": 1
      }
    ],
    "table": {
      "header": [
        "Sep'25",
        "Sep'24",
        "Change(%)"
      ],
      "body": [
        {
          "field": "Net Sales",
          "val1": "6,914.31",
          "val2": "5,634.32",
          "chgp": "22.72%",
          "chgp_class": "positive"
        },
        {
          "field": "Operating Profit (PBDIT) excl Other Income",
          "val1": "1,294.68",
          "val2": "935.94",
          "chgp": "38.33%",
          "chgp_class": "positive"
        },
        {
          "field": "Interest",
          "val1": "35.04",
          "val2": "32.35",
          "chgp": "8.32%",
          "chgp_class": "negative"
        },
        {
          "field": "Exceptional Items",
          "val1": "0.00",
          "val2": "0.00",
          "chgp": "",
          "chgp_class": "neutral"
        },
        {
          "field": "Consolidate Net Profit",
          "val1": "896.41",
          "val2": "631.41",
          "chgp": "41.97%",
          "chgp_class": "positive"
        },
        {
          "field": "Operating Profit Margin (Excl OI)",
          "val1": "18.72%",
          "val2": "16.61%",
          "chgp": "2.11%",
          "chgp_class": "positive"
        }
      ]
    }
  },
  {
    "link": "nine-monthly",
    "btn_text": "All Nine Monthly Results",
    "header": "Nine Monthly Results Snapshot (Consolidated) - Dec'25",
    "rhs": [
      {
        "prefix": "Net Sales ",
        "suffix": "YoY Growth in nine months ended Dec 2025 is 22.95% vs 20.27% in Dec 2024",
        "dir": 1
      },
      {
        "prefix": "Consolidated Net Profit ",
        "suffix": "YoY Growth in nine months ended Dec 2025 is 33.00% vs 29.07% in Dec 2024",
        "dir": 1
      }
    ],
    "table": {
      "header": [
        "Dec'25",
        "Dec'24",
        "Change(%)"
      ],
      "body": [
        {
          "field": "Net Sales",
          "val1": "10,692.52",
          "val2": "8,696.60",
          "chgp": "22.95%",
          "chgp_class": "positive"
        },
        {
          "field": "Operating Profit (PBDIT) excl Other Income",
          "val1": "2,027.75",
          "val2": "1,473.78",
          "chgp": "37.59%",
          "chgp_class": "positive"
        },
        {
          "field": "Interest",
          "val1": "54.00",
          "val2": "48.67",
          "chgp": "10.95%",
          "chgp_class": "negative"
        },
        {
          "field": "Exceptional Items",
          "val1": "-89.03",
          "val2": "0.00",
          "chgp": "",
          "chgp_class": "neutral"
        },
        {
          "field": "Consolidate Net Profit",
          "val1": "1,335.86",
          "val2": "1,004.40",
          "chgp": "33.00%",
          "chgp_class": "positive"
        },
        {
          "field": "Operating Profit Margin (Excl OI)",
          "val1": "18.96%",
          "val2": "16.95%",
          "chgp": "2.01%",
          "chgp_class": "positive"
        }
      ]
    }
  },
  {
    "link": "annual",
    "btn_text": "All Annual Results",
    "header": "Annual Results Snapshot (Consolidated) - Mar'26",
    "rhs": [
      {
        "prefix": "Net Sales ",
        "suffix": "YoY Growth in year ended Mar 2026 is 23.53% vs 21.56% in Mar 2025",
        "dir": 1
      },
      {
        "prefix": "Consolidated Net Profit ",
        "suffix": "YoY Growth in year ended Mar 2026 is 33.21% vs 28.05% in Mar 2025",
        "dir": 1
      }
    ],
    "table": {
      "header": [
        "Mar'26",
        "Mar'25",
        "Change(%)"
      ],
      "body": [
        {
          "field": "Net Sales",
          "val1": "14,748.45",
          "val2": "11,938.72",
          "chgp": "23.53%",
          "chgp_class": "positive"
        },
        {
          "field": "Operating Profit (PBDIT) excl Other Income",
          "val1": "2,795.44",
          "val2": "2,058.20",
          "chgp": "35.82%",
          "chgp_class": "positive"
        },
        {
          "field": "Interest",
          "val1": "72.68",
          "val2": "67.13",
          "chgp": "8.27%",
          "chgp_class": "negative"
        },
        {
          "field": "Exceptional Items",
          "val1": "-89.03",
          "val2": "0.00",
          "chgp": "",
          "chgp_class": "neutral"
        },
        {
          "field": "Consolidate Net Profit",
          "val1": "1,865.12",
          "val2": "1,400.16",
          "chgp": "33.21%",
          "chgp_class": "positive"
        },
        {
          "field": "Operating Profit Margin (Excl OI)",
          "val1": "18.95%",
          "val2": "17.24%",
          "chgp": "1.71%",
          "chgp_class": "positive"
        }
      ]
    }
  }
]

Quarterly Results Snapshot (Consolidated) - Jun'26 - QoQstock-summary

Jun'26
Mar'26
Change(%)
Net Sales
4,303.23
4,055.94
6.10%
Operating Profit (PBDIT) excl Other Income
696.90
767.71
-9.22%
Interest
29.14
18.68
56.00%
Exceptional Items
0.00
0.00
Consolidate Net Profit
483.04
529.26
-8.73%
Operating Profit Margin (Excl OI)
16.19%
18.93%
-2.74%
Values in Rs Cr.
Direction Arrows
Net Sales

QoQ Growth in quarter ended Jun 2026 is 6.10% vs 7.35% in Mar 2026

Direction Arrows
Consolidated Net Profit

QoQ Growth in quarter ended Jun 2026 is -8.73% vs 20.44% in Mar 2026

Half Yearly Results Snapshot (Consolidated) - Sep'25stock-summary

Sep'25
Sep'24
Change(%)
Net Sales
6,914.31
5,634.32
22.72%
Operating Profit (PBDIT) excl Other Income
1,294.68
935.94
38.33%
Interest
35.04
32.35
8.32%
Exceptional Items
0.00
0.00
Consolidate Net Profit
896.41
631.41
41.97%
Operating Profit Margin (Excl OI)
18.72%
16.61%
2.11%
Values in Rs Cr.
Direction Arrows
Net Sales

Growth in half year ended Sep 2025 is 22.72% vs 19.05% in Sep 2024

Direction Arrows
Consolidated Net Profit

Growth in half year ended Sep 2025 is 41.97% vs 28.32% in Sep 2024

Nine Monthly Results Snapshot (Consolidated) - Dec'25stock-summary

Dec'25
Dec'24
Change(%)
Net Sales
10,692.52
8,696.60
22.95%
Operating Profit (PBDIT) excl Other Income
2,027.75
1,473.78
37.59%
Interest
54.00
48.67
10.95%
Exceptional Items
-89.03
0.00
Consolidate Net Profit
1,335.86
1,004.40
33.00%
Operating Profit Margin (Excl OI)
18.96%
16.95%
2.01%
Values in Rs Cr.
Direction Arrows
Net Sales

YoY Growth in nine months ended Dec 2025 is 22.95% vs 20.27% in Dec 2024

Direction Arrows
Consolidated Net Profit

YoY Growth in nine months ended Dec 2025 is 33.00% vs 29.07% in Dec 2024

Annual Results Snapshot (Consolidated) - Mar'26stock-summary

Mar'26
Mar'25
Change(%)
Net Sales
14,748.45
11,938.72
23.53%
Operating Profit (PBDIT) excl Other Income
2,795.44
2,058.20
35.82%
Interest
72.68
67.13
8.27%
Exceptional Items
-89.03
0.00
Consolidate Net Profit
1,865.12
1,400.16
33.21%
Operating Profit Margin (Excl OI)
18.95%
17.24%
1.71%
Values in Rs Cr.
Direction Arrows
Net Sales

YoY Growth in year ended Mar 2026 is 23.53% vs 21.56% in Mar 2025

Direction Arrows
Consolidated Net Profit

YoY Growth in year ended Mar 2026 is 33.21% vs 28.05% in Mar 2025

stock-summaryCompany CV
About Persistent Systems Ltd stock-summary
stock-summary
Persistent Systems Ltd
Mid Cap
Computers - Software & Consulting
Persistent Systems Limited was incorporated as 'Persistent Systems Private Limited' on May 30, 1990 and in September, 2007, the company converted into a public limited company and name was changed to Persistent Systems Limited. The company has depth of experience in the focused areas of telecommunications, life sciences and infrastructure and systems.
Company Coordinates stock-summary
Company Details
Bhageerath, 402 Senapati Bapat Road Pune Maharashtra : 411016
stock-summary
Tel: 91-020-67030000/67462084
stock-summary
info@persistent.com
Registrar Details
Link Intime India Pvt Ltd, Block No 202, 2nd Floor, Akshay Complex, Near Ganesh Temple, Off Dhole Patil Road , Pune