
Compare PFL Infotech with Similar Stocks
Dashboard
With a Negative Book Value, the company has a Weak Long Term Fundamental Strength
- Poor long term growth as Net Sales has grown by an annual rate of % and Operating profit at 0% over the last 5 years
- The company has a negative book value of Rs 0.41 crore
Flat results in Mar 26
Risky - Negative EBITDA
Below par performance in long term as well as near term
Total Returns (Price + Dividend) 
PFL Infotech for the last several years.
Risk Adjusted Returns v/s
Returns Beta

News
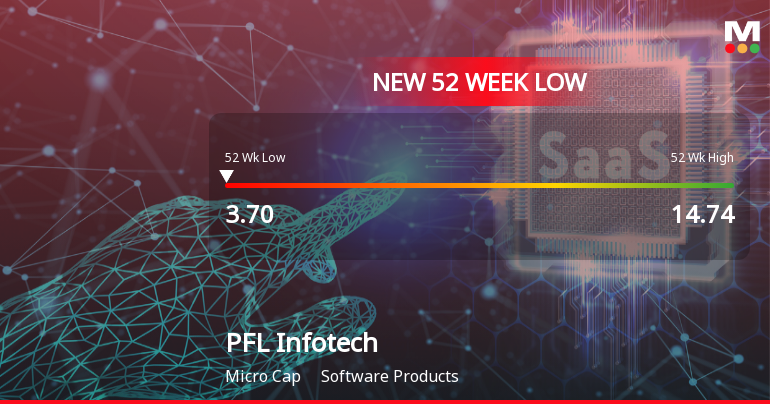
PFL Infotech Ltd Falls to 52-Week Low of Rs 3.7 as Sell-Off Deepens
For the third consecutive session, PFL Infotech Ltd has seen its share price decline, culminating in a fresh 52-week low of Rs 3.7 on 9 Jun 2026. This latest drop extends the stock’s downward spiral, which has wiped out over 8% in just three days, underscoring persistent selling pressure amid challenging fundamentals.
Read full news article
PFL Infotech Ltd Falls to 52-Week Low of Rs 3.8 as Sell-Off Deepens
For the second consecutive session, PFL Infotech Ltd has seen its share price decline sharply, hitting a fresh 52-week low of Rs 3.8 on 2 Jun 2026. This drop comes despite a broadly resilient IT sector and a Sensex that, while slightly lower, remains well above its own yearly lows.
Read full news articleAre PFL Infotech Ltd latest results good or bad?
The latest financial results for PFL Infotech Ltd indicate a challenging situation for the company. In the quarter ended March 2026, the company reported net sales of ₹0.00 crores, marking a continuation of a trend where the company has not generated any revenue for at least seven consecutive quarters. This lack of sales reflects a complete cessation of commercial operations. The net profit for the quarter was a loss of ₹0.02 crores, consistent with previous quarters, indicating ongoing operational difficulties. The company's financial metrics reveal a significant deterioration in its balance sheet. Shareholder equity has become negative, with reserves and surplus deeply in the red, highlighting a critical financial distress situation. The book value per share is reported at ₹0.11, suggesting severely eroded equity. Furthermore, the company has minimal employee costs, indicating a skeletal operational stru...
Read full news article Announcements
Outcome Of Board Meeting And Submission Of Audited Financial Results For The Fourth Quarter And Financial Year Ended March 31 2026
30-May-2026 | Source : BSEResults
Board Meeting Outcome for Outcome Of Board Meeting And Submission Of Audited Financial Results For The Fourth Quarter And Financial Year Ended March 31 2026
30-May-2026 | Source : BSEThis has reference to our letter dated May 15 2026 The Board of Directors of the Company at their meeting held on May 30 2026 have resolved as follows: Pursuant to Regulation 33 of the SEBI (Listing Obligations and Disclosure Requirements) Regulations 2015 we enclose herewith the following: a) Audited Financial Results (Standalone) of the Company for the fourth quarter and financial year ended March 31 2026. b) Report of the Auditors on the Audited Financial Results both for (Standalone) financial statements for the financial year ended March 31 2026. c) Declaration pursuant to Regulation 33(3)(d) of SEBI (Listing Obligations and Disclosure Requirements) Regulations 2015 for Standalone Financial Statements for the Financial Year ended March 31 2026
Board Meeting Intimation for Intimation Of The Board Meeting To Be Held On Saturday 30Th May 2026
22-May-2026 | Source : BSEPFL Infotech Ltdhas informed BSE that the meeting of the Board of Directors of the Company is scheduled on 30/05/2026 inter alia to consider and approve To consider and approve the Audited Financial Results (Standalone) of the Company for the quarter and financial year ended March 31 2026.
Corporate Actions

No Upcoming Board Meetings

No Dividend history available

No Splits history available

No Bonus history available

No Rights history available
Quality key factors
Valuation key factors
Technicals key factors
 Technical Indicator Scale: Bearish, Mildly Bearish, Sideways, Mildly Bullish, Bullish Turned
 Shareholding Snapshot : Mar 2026
Shareholding Compare (%holding)
Non Institution
None
Held by 0 Schemes
Held by 0 FIIs
Parmanand Chand (6.5%)
Awadhoot Marketing Pvt.ltd (1.71%)
77.09%
Quarterly Results Snapshot (Standalone) - Mar'26 - QoQ
QoQ Growth in quarter ended Mar 2026 is 0.00% vs 0.00% in Dec 2025

QoQ Growth in quarter ended Mar 2026 is 0.00% vs 33.33% in Dec 2025
Half Yearly Results Snapshot (Standalone) - Sep'25
Growth in half year ended Sep 2025 is 0.00% vs 0.00% in Sep 2024

Growth in half year ended Sep 2025 is -275.00% vs -500.00% in Sep 2024
Nine Monthly Results Snapshot (Standalone) - Dec'25
YoY Growth in nine months ended Dec 2025 is 0.00% vs 0.00% in Dec 2024
YoY Growth in nine months ended Dec 2025 is -261.54% vs -333.33% in Dec 2024
Annual Results Snapshot (Standalone) - Mar'26
YoY Growth in year ended Mar 2026 is 0.00% vs 0.00% in Mar 2025
YoY Growth in year ended Mar 2026 is -40.00% vs 93.85% in Mar 2025
About PFL Infotech Ltd

Company Coordinates


