
Compare PG Electroplast with Similar Stocks
Stock DNA
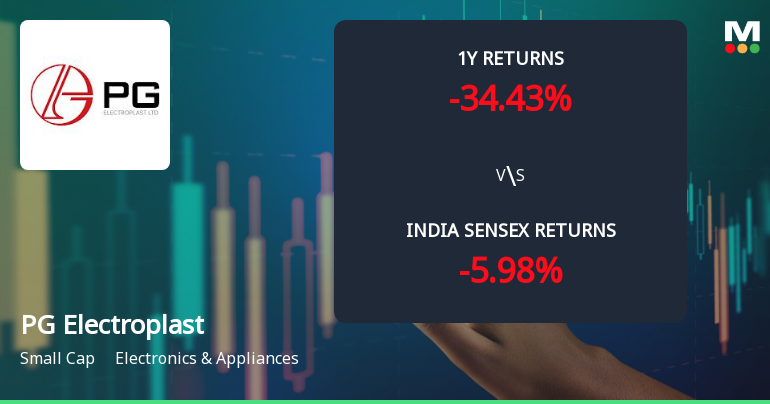
Electronics & Appliances
INR 14,652 Cr (Small Cap)
71.00
55
0.05%
0.07
6.45%
4.59
Total Returns (Price + Dividend) 
Latest dividend: 0.24864864864864863 per share ex-dividend date: Sep-19-2025
Risk Adjusted Returns v/s
Returns Beta

News
PG Electroplast Ltd Technical Momentum Shifts Amid Mixed Market Signals
PG Electroplast Ltd, a small-cap player in the Electronics & Appliances sector, has recently exhibited a nuanced shift in its technical momentum, reflecting a complex interplay of bearish and mildly bullish signals across key indicators. Despite a modest day gain of 2.05%, the stock’s broader technical profile suggests cautious investor sentiment amid mixed trend assessments.
Read full news article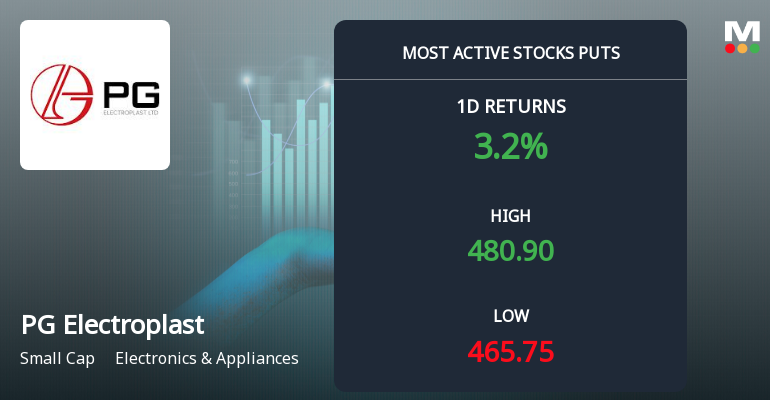
Rs 470 Puts — Just Below Current Price — Draw 1,989 Contracts on PG Electroplast Ltd
Rs 470 put options on PG Electroplast Ltd attracted 1,989 contracts on 12 Jun 2026, signalling notable activity just below the stock’s current price of Rs 474.95. This surge in put trading invites a closer look at whether the options market is signalling caution, protection, or a more nuanced positioning.
Read full news article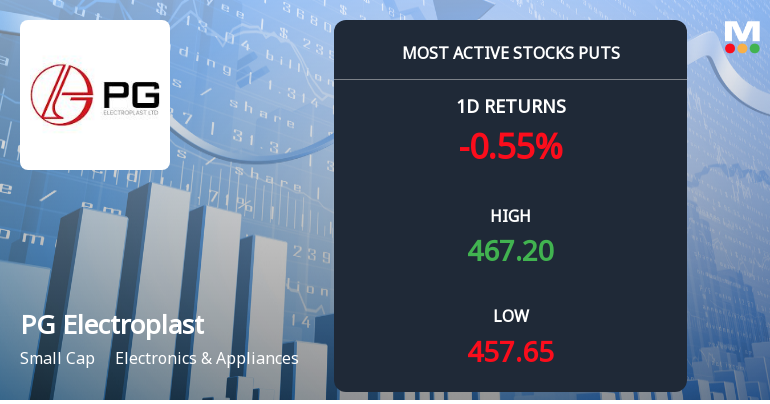
Rs 460 Puts — 1.2% Below Current Price — Draw 1,850 Contracts on PG Electroplast Ltd
Rs 460 put options on PG Electroplast Ltd attracted 1,850 contracts on 11 Jun 2026, signalling notable activity just below the current stock price of Rs 465.65. The proximity of this strike to the underlying price, combined with the stock’s recent downtrend, suggests a nuanced interpretation of the put market’s intent.
Read full news article Announcements
Announcement under Regulation 30 (LODR)-Analyst / Investor Meet - Intimation
08-Jun-2026 | Source : BSEInvestor Meet Intimation Dated - 11.06.2026
Announcement under Regulation 30 (LODR)-Earnings Call Transcript
30-May-2026 | Source : BSETranscript of Earnings Conference Call.
Announcement under Regulation 30 (LODR)-Allotment of ESOP / ESPS
30-May-2026 | Source : BSEGrant of Options under PG Electroplast Employees Stock Option Scheme - 2020.
Corporate Actions

No Upcoming Board Meetings

PG Electroplast Ltd has declared 25% dividend, ex-date: 19 Sep 25

PG Electroplast Ltd has announced 1:10 stock split, ex-date: 10 Jul 24

No Bonus history available

No Rights history available
Quality key factors
Valuation key factors
Technicals key factors
 Technical Indicator Scale: Bearish, Mildly Bearish, Sideways, Mildly Bullish, Bullish Turned
 Shareholding Snapshot : Mar 2026
Shareholding Compare (%holding)
Promoters
None
Held by 27 Schemes (19.42%)
Held by 104 FIIs (9.74%)
Vishal Gupta (16.05%)
Motilal Oswal Nifty 500 Index Fund (4.74%)
18.03%
Quarterly Results Snapshot (Consolidated) - Mar'26 - YoY

YoY Growth in quarter ended Mar 2026 is -10.11% vs 77.40% in Mar 2025
YoY Growth in quarter ended Mar 2026 is -55.34% vs 108.81% in Mar 2025
Half Yearly Results Snapshot (Consolidated) - Sep'25
Growth in half year ended Sep 2025 is 8.40% vs 75.04% in Sep 2024
Growth in half year ended Sep 2025 is -32.30% vs 123.13% in Sep 2024
Nine Monthly Results Snapshot (Consolidated) - Dec'25
YoY Growth in nine months ended Dec 2025 is 20.67% vs 77.23% in Dec 2024
YoY Growth in nine months ended Dec 2025 is -7.62% vs 118.15% in Dec 2024
Annual Results Snapshot (Consolidated) - Mar'26
YoY Growth in year ended Mar 2026 is 8.59% vs 77.30% in Mar 2025
YoY Growth in year ended Mar 2026 is -31.70% vs 113.34% in Mar 2025
About PG Electroplast Ltd

Company Coordinates


