
Compare Phoenix Township with Similar Stocks
Dashboard
Poor Management Efficiency with a low ROE of 1.09%
- The company has been able to generate a Return on Equity (avg) of 1.09% signifying low profitability per unit of shareholders funds
Low ability to service debt as the company has a high Debt to EBITDA ratio of 1.86 times
The company has declared Negative results for the last 3 consecutive quarters
With ROCE of 1, it has a Very Expensive valuation with a 0.7 Enterprise value to Capital Employed
Below par performance in long term as well as near term
Total Returns (Price + Dividend) 
Latest dividend: 0.1 per share ex-dividend date: Sep-22-2025
Risk Adjusted Returns v/s
Returns Beta

News

Phoenix Township Ltd is Rated Strong Sell
Phoenix Township Ltd is rated Strong Sell by MarketsMOJO. This rating was last updated on 17 Feb 2026, reflecting a reassessment of the stock’s outlook. However, all fundamentals, returns, and financial metrics discussed here are current as of 06 April 2026, providing investors with the latest perspective on the company’s performance and prospects.
Read full news article
Phoenix Township Ltd is Rated Strong Sell
Phoenix Township Ltd is rated Strong Sell by MarketsMOJO. This rating was last updated on 17 February 2026, reflecting a reassessment of the stock’s outlook. However, all fundamentals, returns, and financial metrics discussed below are based on the company’s current position as of 25 March 2026, providing investors with the latest insights into the stock’s performance and prospects.
Read full news article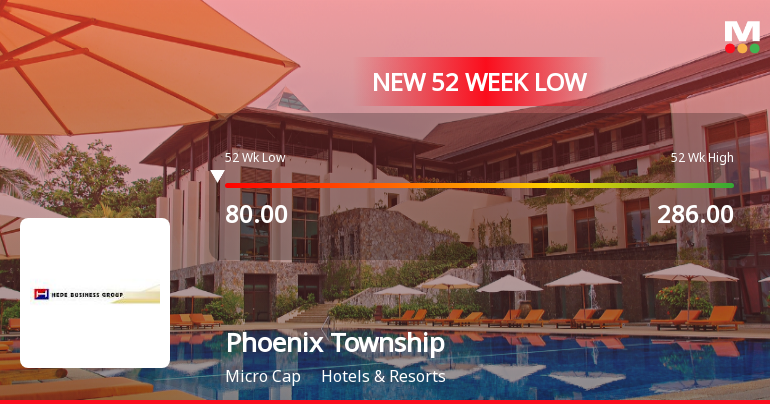
Phoenix Township Ltd Falls to 52-Week Low of Rs 73 as Sell-Off Deepens
For the fourth consecutive session, Phoenix Township Ltd has seen its share price decline, culminating in a fresh 52-week low of Rs 73 on 24 Mar 2026. This marks a steep drop of 16.42% over the past four days, underscoring persistent selling pressure despite an intraday high of Rs 81.74 today.
Read full news article Announcements
Financial Result For The Quarter Ended December 31St 2025
11-Feb-2026 | Source : BSEEnclosed herewith Financial Result for the quarter ended December 31st 2025
Board Meeting Outcome for Outcome Of The Board Meeting
11-Feb-2026 | Source : BSEOutcome of Board Meeting
Update on board meeting
06-Feb-2026 | Source : BSEThe Board Meeting to be held on 11/02/2026 has been revised to 11/02/2026 The Board Meeting to be held on 11/02/2026 has been revised to 11/02/2026 the venue and time of the board meeting has been changed
Corporate Actions

No Upcoming Board Meetings

Phoenix Township Ltd has declared 1% dividend, ex-date: 22 Sep 25

No Splits history available

No Bonus history available

No Rights history available
Quality key factors
Valuation key factors
Technicals key factors
 Technical Indicator Scale: Bearish, Mildly Bearish, Sideways, Mildly Bullish, Bullish Turned
 Shareholding Snapshot : Dec 2025
Shareholding Compare (%holding)
Promoters
None
Held by 0 Schemes
Held by 3 FIIs (1.08%)
Hede Navigation Private Limited (24.23%)
M/s Black Hawk Properties Private Limited (1.72%)
21.87%
Quarterly Results Snapshot (Consolidated) - Dec'25 - QoQ

QoQ Growth in quarter ended Dec 2025 is 46.60% vs 3.60% in Sep 2025

QoQ Growth in quarter ended Dec 2025 is -16.09% vs 295.45% in Sep 2025
Half Yearly Results Snapshot (Consolidated) - Sep'25
Growth in half year ended Sep 2025 is -19.33% vs 28.82% in Sep 2024
Growth in half year ended Sep 2025 is -53.02% vs 954.55% in Sep 2024
Nine Monthly Results Snapshot (Consolidated) - Dec'25
YoY Growth in nine months ended Dec 2025 is -18.07% vs 32.22% in Dec 2024
YoY Growth in nine months ended Dec 2025 is -59.82% vs 607.81% in Dec 2024
Annual Results Snapshot (Standalone) - Mar'25
YoY Growth in year ended Mar 2025 is 4.08% vs 6.23% in Mar 2024
YoY Growth in year ended Mar 2025 is -71.46% vs 28,786.76% in Mar 2024
About Phoenix Township Ltd

Company Coordinates


