
Compare Phyto Chem (I) with Similar Stocks
Dashboard
With a Operating Losses, the company has a Weak Long Term Fundamental Strength
- Poor long term growth as Net Sales has grown by an annual rate of -27.26% and Operating profit at -204.42% over the last 5 years
- High Debt Company with a Debt to Equity ratio (avg) of 2.33 times
- The company has been able to generate a Return on Equity (avg) of 1.88% signifying low profitability per unit of shareholders funds
Flat results in Mar 26
Risky - Negative EBITDA
Consistent Underperformance against the benchmark over the last 3 years
Stock DNA
Pesticides & Agrochemicals
INR 10 Cr (Micro Cap)
NA (Loss Making)
29
0.00%
2.75
-33.58%
1.84
Total Returns (Price + Dividend) 
Latest dividend: 1.0000 per share ex-dividend date: Sep-25-2014
Risk Adjusted Returns v/s
Returns Beta

News
Are Phyto Chem (India) Ltd latest results good or bad?
Phyto Chem (India) Ltd's latest financial results for the quarter ended March 2026 reveal significant operational challenges. The company reported net sales of ₹0.23 crores, which reflects a substantial year-on-year decline of 84.25% from ₹1.46 crores in the same quarter last year. This dramatic drop in revenue raises serious concerns about the sustainability of its business model, particularly in the competitive agrochemicals sector. The operational performance is further underscored by the reported net loss of ₹0.28 crores, marking the fourth consecutive quarter of losses. The operating margin for this period was recorded at -282.61%, indicating that fixed costs are far exceeding revenue generation capabilities. This is a stark contrast to the previous year's margin of -71.92%, highlighting a worsening financial situation. Phyto Chem's return on equity (ROE) stands at -50.00%, signaling significant capi...
Read full news article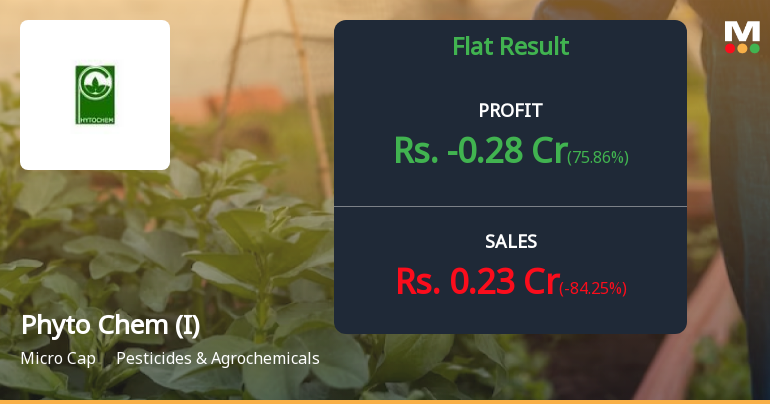
Phyto Chem (India) Q4 FY26: Deepening Losses Signal Fundamental Distress
Phyto Chem (India) Limited, a micro-cap pesticides and agrochemicals manufacturer, reported a net loss of ₹0.28 crores in Q4 FY26 (Mar'26), marking the fourth consecutive quarter of losses for the Telangana-based company. The stock plunged 6.31% to ₹26.00 following the results announcement, reflecting investor concerns over the company's deteriorating financial health and operational challenges. With a market capitalisation of just ₹12.00 crores, Phyto Chem faces mounting pressure as revenue collapsed 92.26% quarter-on-quarter and 84.25% year-on-year to a mere ₹0.23 crores, raising serious questions about the company's viability.
Read full news article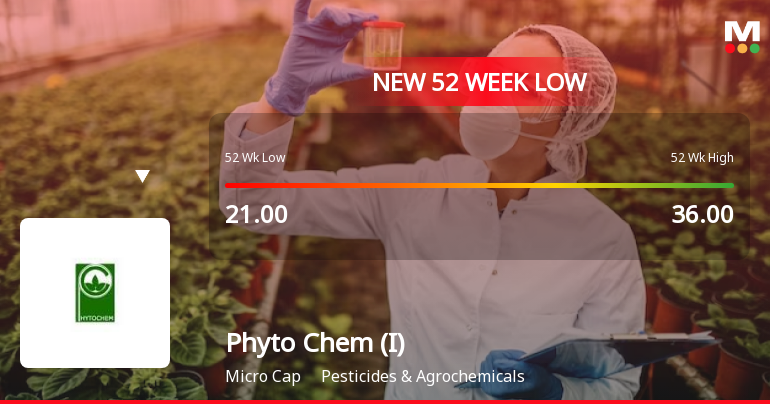
Five Consecutive Losses Push Phyto Chem (India) Ltd to a New 52-Week Low
For the fifth consecutive session, Phyto Chem (India) Ltd has closed lower, hitting a fresh 52-week low of Rs 19 on 30 Mar 2026. This marks a steep decline of over 20% in just three days, underscoring persistent selling pressure amid a volatile trading environment.
Read full news article Announcements
Announcement under Regulation 30 (LODR)-Newspaper Publication
30-May-2026 | Source : BSEPursuant to Regulation 47 of the SEBI (LODR) regulation 2015 please find enclosed copies of the newspaper advertisement pertaining Audited Financial Results of the Company for the Quarter and Year ended March 31 2026. The advertisements were published in Business Standard (English) and Andhra Prabha (Telugu) on May 30 2026.
Compliances-Reg.24(A)-Annual Secretarial Compliance
30-May-2026 | Source : BSEPursuant to Regulation 24A of SEBI (Listing Obligations and Disclosure Requirements) Regulations 2015 read with SEBI Circular No. CIR/CFD/CMD1/27/2019 dated February 08 2019 please find attached Annual Secretarial Compliance Report of Phyto Chem (India) Limited for the financial year ended March 31 2026.
Results-Financial Results For May 29Th 2026(Submission Of Audited Financial Results Of The Company For The Fourth Quarter & Year Ended 31St March 2026
29-May-2026 | Source : BSEIn furtherance to the Board Meeting Notice dt.22nd May 2026 we wish to inform you that at the meeting of Board of Directors of M/s. Phyto Chem (India) Limited held today i.e. on 29th May 2026 the Board has considered and approved the Audited Financials for the 4th Quarter and year ended 31st March 2026. The said Audited Financial Results were reviewed by the Audit Committee and thereafter approved by the Board. Pursuant to Regulation 33 of the SEBI(LODR) Regulations 2015 statement showing the Audited Financial Results for the 4th Quarter & Year ended 31st March 2026 along with the statement of Assets & Liabilities Cash Flow statement and Auditors Report of the Statutory Auditors are enclosed herewith. Persuant Reg. 33(3)(d) of the SEBI (LODR) Regulation2015 the Board declares the the above said Auditors Reports are with unmodified opinion with respect to the Audited Financial Results for the 4th Quarter & Year ended 31st March 2026.
Corporate Actions

No Upcoming Board Meetings

Phyto Chem (India) Ltd has declared 10% dividend, ex-date: 25 Sep 14

No Splits history available

No Bonus history available

No Rights history available
Quality key factors
Valuation key factors
Technicals key factors
 Technical Indicator Scale: Bearish, Mildly Bearish, Sideways, Mildly Bullish, Bullish Turned
 Shareholding Snapshot : Mar 2026
Shareholding Compare (%holding)
Non Institution
None
Held by 2 Schemes (0.19%)
Held by 0 FIIs
Nayudamma Yarlagadda (7.87%)
None
49.64%
Quarterly Results Snapshot (Standalone) - Mar'26 - YoY

YoY Growth in quarter ended Mar 2026 is -84.25% vs 224.44% in Mar 2025

YoY Growth in quarter ended Mar 2026 is 75.86% vs 32.16% in Mar 2025
Half Yearly Results Snapshot (Standalone) - Sep'25
Growth in half year ended Sep 2025 is -34.63% vs 14.39% in Sep 2024
Growth in half year ended Sep 2025 is 23.53% vs 29.17% in Sep 2024
Nine Monthly Results Snapshot (Standalone) - Dec'25
YoY Growth in nine months ended Dec 2025 is -30.01% vs -12.11% in Dec 2024
YoY Growth in nine months ended Dec 2025 is -1,050.00% vs 109.82% in Dec 2024
Annual Results Snapshot (Standalone) - Mar'26
YoY Growth in year ended Mar 2026 is -35.58% vs -4.93% in Mar 2025
YoY Growth in year ended Mar 2026 is -81.82% vs 70.27% in Mar 2025
About Phyto Chem (India) Ltd

Company Coordinates


